

216
in Fig. 7.9.
16
Such a map may be presented by means of a table, listing the relevant
pairs (x i , θ j ), or a (local values, public values) chart, through which any obtained
indication value can be associated with a measured value. In some cases, the pre16 Under the hypothesis that the instrument behavior is modeled by an analytical function, and the
underlying structure of the evaluation is sufficiently rich (see Sect. 6.5.3), this pointwise map may
be interpolated, so as to obtain pairs (local value, public value) also for public values for which the
instrument was not directly calibrated. For example the thermometer could be hypothesized to
behave in a linear way between the freezing and the boiling point of water—i.e., a change of the
measured temperature produces a proportional change of the position of the upper surface of alcohol in the tube—so that the midpoint of the upper surface would be mapped to 50 °C, and so on.
Of course, the thermometer could be calibrated even if its behavior were not linear, but this would
require the availability of other public reference temperatures, intermediate between the freezing
and the boiling point of water.
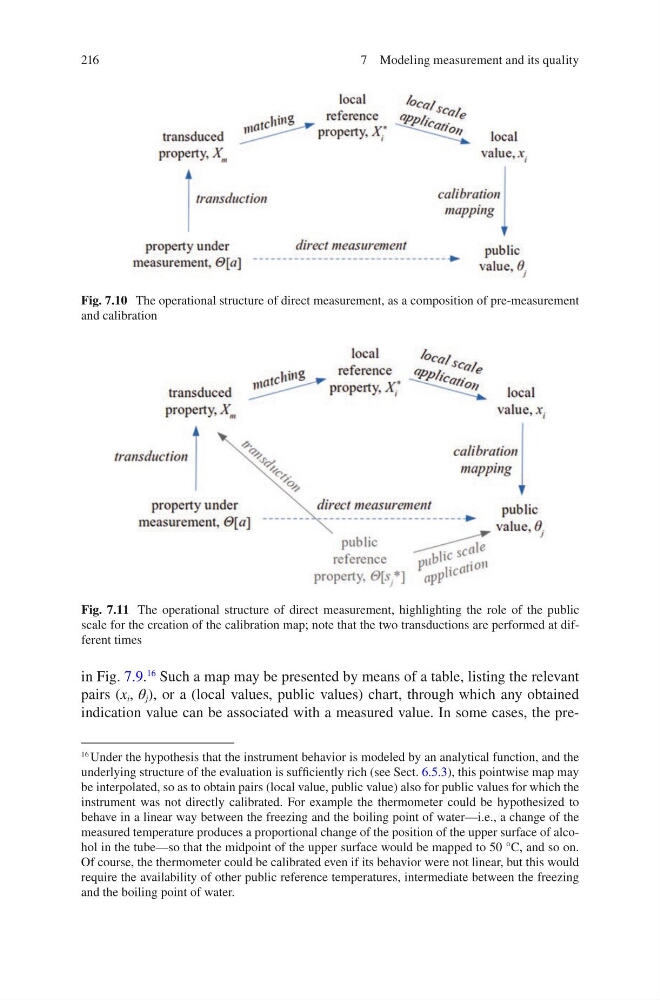
Fig. 7.10 The operational structure of direct measurement, as a composition of pre-measurement
and calibration
Fig. 7.11 The operational structure of direct measurement, highlighting the role of the public
scale for the creation of the calibration map; note that the two transductions are performed at different times
7 Modeling measurement and its quality
in Fig. 7.9.
16
Such a map may be presented by means of a table, listing the relevant
pairs (x i , θ j ), or a (local values, public values) chart, through which any obtained
indication value can be associated with a measured value. In some cases, the pre16 Under the hypothesis that the instrument behavior is modeled by an analytical function, and the
underlying structure of the evaluation is sufficiently rich (see Sect. 6.5.3), this pointwise map may
be interpolated, so as to obtain pairs (local value, public value) also for public values for which the
instrument was not directly calibrated. For example the thermometer could be hypothesized to
behave in a linear way between the freezing and the boiling point of water—i.e., a change of the
measured temperature produces a proportional change of the position of the upper surface of alcohol in the tube—so that the midpoint of the upper surface would be mapped to 50 °C, and so on.
Of course, the thermometer could be calibrated even if its behavior were not linear, but this would
require the availability of other public reference temperatures, intermediate between the freezing
and the boiling point of water.
Fig. 7.10 The operational structure of direct measurement, as a composition of pre-measurement
and calibration
Fig. 7.11 The operational structure of direct measurement, highlighting the role of the public
scale for the creation of the calibration map; note that the two transductions are performed at different times
7 Modeling measurement and its quality