

2.2 Results
35
a
10b: Ac-Cys-Ala-Ala-Ile-S 5 (2-Ph)-NH 2
b
c
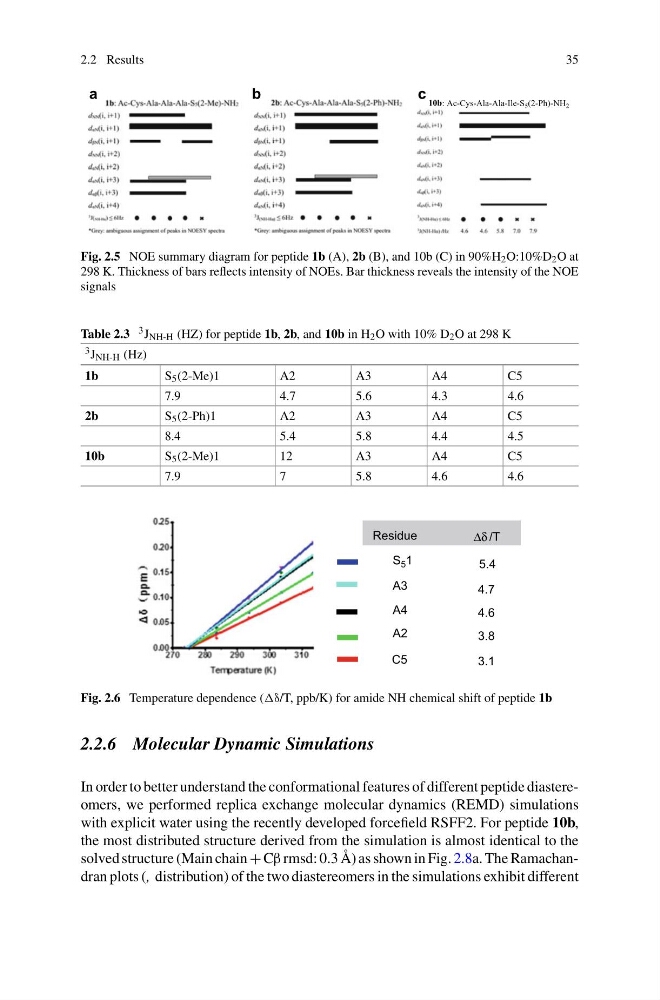
Fig. 2.5 NOE summary diagram for peptide 1b (A), 2b (B), and 10b (C) in 90%H 2 O:10%D 2 O at
298 K. Thickness of bars reflects intensity of NOEs. Bar thickness reveals the intensity of the NOE
signals
Table 2.3 3 J NH-H (HZ) for peptide 1b, 2b, and 10b in H 2 O with 10% D 2 O at 298 K
3 J NH-H (Hz)
1b
S 5 (2-Me)1
A2
A3
A4
C5
7.9
4.7
5.6
4.3
4.6
2b
S 5 (2-Ph)1
A2
A3
A4
C5
8.4
5.4
5.8
4.4
4.5
10b
S 5 (2-Me)1
12
A3
A4
C5
7.9
7
5.8
4.6
4.6
S 5 1
A3
A4
A2
C5
5.4
4.7
4.6
3.8
3.1
Residue
Δδ /T
Fig. 2.6 Temperature dependence ( ppb/K) for amide NH chemical shift of peptide 1b
2.2.6 Molecular Dynamic Simulations
In order to better understand the conformational features of different peptide diastereomers, we performed replica exchange molecular dynamics (REMD) simulations
with explicit water using the recently developed forcefield RSFF2. For peptide 10b,
the most distributed structure derived from the simulation is almost identical to the
solved structure (Main chain + Cβ rmsd: 0.3 Å) as shown in Fig. 2.8a. The Ramachandran plots (, distribution) of the two diastereomers in the simulations exhibit different
35
a
10b: Ac-Cys-Ala-Ala-Ile-S 5 (2-Ph)-NH 2
b
c
Fig. 2.5 NOE summary diagram for peptide 1b (A), 2b (B), and 10b (C) in 90%H 2 O:10%D 2 O at
298 K. Thickness of bars reflects intensity of NOEs. Bar thickness reveals the intensity of the NOE
signals
Table 2.3 3 J NH-H (HZ) for peptide 1b, 2b, and 10b in H 2 O with 10% D 2 O at 298 K
3 J NH-H (Hz)
1b
S 5 (2-Me)1
A2
A3
A4
C5
7.9
4.7
5.6
4.3
4.6
2b
S 5 (2-Ph)1
A2
A3
A4
C5
8.4
5.4
5.8
4.4
4.5
10b
S 5 (2-Me)1
12
A3
A4
C5
7.9
7
5.8
4.6
4.6
S 5 1
A3
A4
A2
C5
5.4
4.7
4.6
3.8
3.1
Residue
Δδ /T
Fig. 2.6 Temperature dependence ( ppb/K) for amide NH chemical shift of peptide 1b
2.2.6 Molecular Dynamic Simulations
In order to better understand the conformational features of different peptide diastereomers, we performed replica exchange molecular dynamics (REMD) simulations
with explicit water using the recently developed forcefield RSFF2. For peptide 10b,
the most distributed structure derived from the simulation is almost identical to the
solved structure (Main chain + Cβ rmsd: 0.3 Å) as shown in Fig. 2.8a. The Ramachandran plots (, distribution) of the two diastereomers in the simulations exhibit different