

and 0.25 ± 0.10 mm/yr for Antarctica for 1993–2017. The
ice-sheet contribution to sea-level rise has been increasing
from 27% of the total contributions for 1993–2017 to 40%
for 2005–2017.
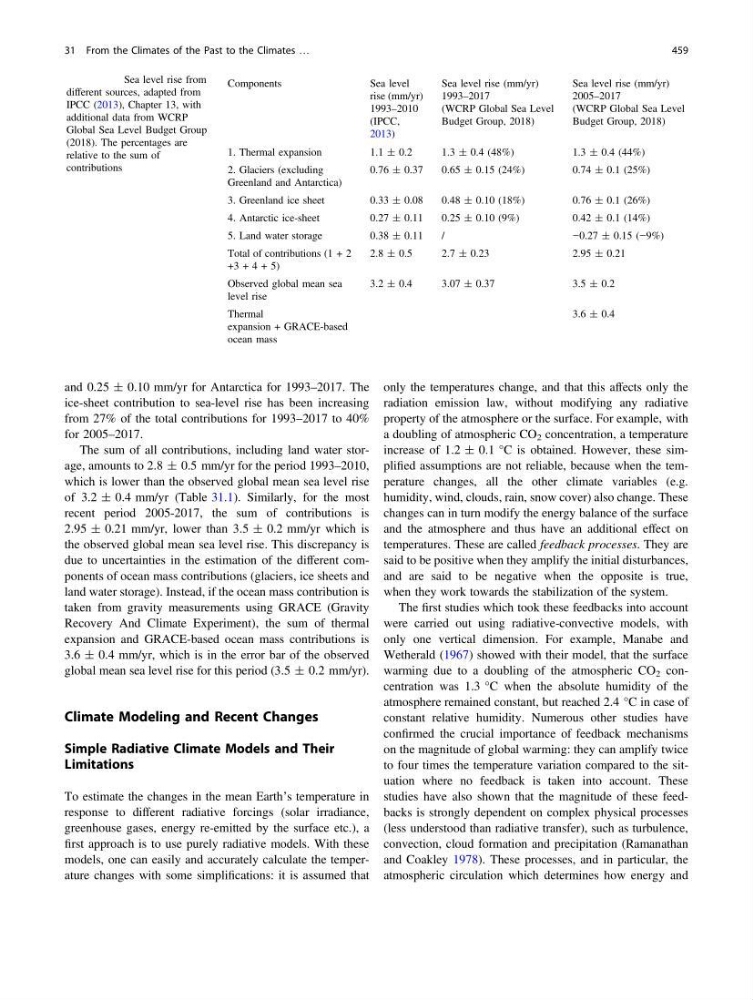
The sum of all contributions, including land water storage, amounts to 2.8 ± 0.5 mm/yr for the period 1993–2010,
which is lower than the observed global mean sea level rise
of 3.2 ± 0.4 mm/yr (Table 31.1). Similarly, for the most
recent period 2005-2017, the sum of contributions is
2.95 ± 0.21 mm/yr, lower than 3.5 ± 0.2 mm/yr which is
the observed global mean sea level rise. This discrepancy is
due to uncertainties in the estimation of the different components of ocean mass contributions (glaciers, ice sheets and
land water storage). Instead, if the ocean mass contribution is
taken from gravity measurements using GRACE (Gravity
Recovery And Climate Experiment), the sum of thermal
expansion and GRACE-based ocean mass contributions is
3.6 ± 0.4 mm/yr, which is in the error bar of the observed
global mean sea level rise for this period (3.5 ± 0.2 mm/yr).
Climate Modeling and Recent Changes
Simple Radiative Climate Models and Their
Limitations
To estimate the changes in the mean Earth’s temperature in
response to different radiative forcings (solar irradiance,
greenhouse gases, energy re-emitted by the surface etc.), a
first approach is to use purely radiative models. With these
models, one can easily and accurately calculate the temperature changes with some simplifications: it is assumed that
only the temperatures change, and that this affects only the
radiation emission law, without modifying any radiative
property of the atmosphere or the surface. For example, with
a doubling of atmospheric CO 2 concentration, a temperature
increase of 1.2 ± 0.1 °C is obtained. However, these simplified assumptions are not reliable, because when the temperature changes, all the other climate variables (e.g.
humidity, wind, clouds, rain, snow cover) also change. These
changes can in turn modify the energy balance of the surface
and the atmosphere and thus have an additional effect on
temperatures. These are called feedback processes. They are
said to be positive when they amplify the initial disturbances,
and are said to be negative when the opposite is true,
when they work towards the stabilization of the system.
The first studies which took these feedbacks into account
were carried out using radiative-convective models, with
only one vertical dimension. For example, Manabe and
Wetherald (1967) showed with their model, that the surface
warming due to a doubling of the atmospheric CO 2 concentration was 1.3 °C when the absolute humidity of the
atmosphere remained constant, but reached 2.4 °C in case of
constant relative humidity. Numerous other studies have
confirmed the crucial importance of feedback mechanisms
on the magnitude of global warming: they can amplify twice
to four times the temperature variation compared to the situation where no feedback is taken into account. These
studies have also shown that the magnitude of these feedbacks is strongly dependent on complex physical processes
(less understood than radiative transfer), such as turbulence,
convection, cloud formation and precipitation (Ramanathan
and Coakley 1978). These processes, and in particular, the
atmospheric circulation which determines how energy and
Table 31.1 Sea level rise from
different sources, adapted from
IPCC (2013), Chapter 13, with
additional data from WCRP
Global Sea Level Budget Group
(2018). The percentages are
relative to the sum of
contributions
Components
Sea level
rise (mm/yr)
1993–2010
(IPCC,
2013)
Sea level rise (mm/yr)
1993–2017
(WCRP Global Sea Level
Budget Group, 2018)
Sea level rise (mm/yr)
2005–2017
(WCRP Global Sea Level
Budget Group, 2018)
1. Thermal expansion
1.1 ± 0.2
1.3 ± 0.4 (48%)
1.3 ± 0.4 (44%)
2. Glaciers (excluding
Greenland and Antarctica)
0.76 ± 0.37
0.65 ± 0.15 (24%)
0.74 ± 0.1 (25%)
3. Greenland ice sheet
0.33 ± 0.08
0.48 ± 0.10 (18%)
0.76 ± 0.1 (26%)
4. Antarctic ice-sheet
0.27 ± 0.11
0.25 ± 0.10 (9%)
0.42 ± 0.1 (14%)
5. Land water storage
0.38 ± 0.11
/
−0.27 ± 0.15 (−9%)
Total of contributions (1 + 2
+3 + 4 + 5)
2.8 ± 0.5
2.7 ± 0.23
2.95 ± 0.21
Observed global mean sea
level rise
3.2 ± 0.4
3.07 ± 0.37
3.5 ± 0.2
Thermal
expansion + GRACE-based
ocean mass
3.6 ± 0.4
31 From the Climates of the Past to the Climates …
459
ice-sheet contribution to sea-level rise has been increasing
from 27% of the total contributions for 1993–2017 to 40%
for 2005–2017.
The sum of all contributions, including land water storage, amounts to 2.8 ± 0.5 mm/yr for the period 1993–2010,
which is lower than the observed global mean sea level rise
of 3.2 ± 0.4 mm/yr (Table 31.1). Similarly, for the most
recent period 2005-2017, the sum of contributions is
2.95 ± 0.21 mm/yr, lower than 3.5 ± 0.2 mm/yr which is
the observed global mean sea level rise. This discrepancy is
due to uncertainties in the estimation of the different components of ocean mass contributions (glaciers, ice sheets and
land water storage). Instead, if the ocean mass contribution is
taken from gravity measurements using GRACE (Gravity
Recovery And Climate Experiment), the sum of thermal
expansion and GRACE-based ocean mass contributions is
3.6 ± 0.4 mm/yr, which is in the error bar of the observed
global mean sea level rise for this period (3.5 ± 0.2 mm/yr).
Climate Modeling and Recent Changes
Simple Radiative Climate Models and Their
Limitations
To estimate the changes in the mean Earth’s temperature in
response to different radiative forcings (solar irradiance,
greenhouse gases, energy re-emitted by the surface etc.), a
first approach is to use purely radiative models. With these
models, one can easily and accurately calculate the temperature changes with some simplifications: it is assumed that
only the temperatures change, and that this affects only the
radiation emission law, without modifying any radiative
property of the atmosphere or the surface. For example, with
a doubling of atmospheric CO 2 concentration, a temperature
increase of 1.2 ± 0.1 °C is obtained. However, these simplified assumptions are not reliable, because when the temperature changes, all the other climate variables (e.g.
humidity, wind, clouds, rain, snow cover) also change. These
changes can in turn modify the energy balance of the surface
and the atmosphere and thus have an additional effect on
temperatures. These are called feedback processes. They are
said to be positive when they amplify the initial disturbances,
and are said to be negative when the opposite is true,
when they work towards the stabilization of the system.
The first studies which took these feedbacks into account
were carried out using radiative-convective models, with
only one vertical dimension. For example, Manabe and
Wetherald (1967) showed with their model, that the surface
warming due to a doubling of the atmospheric CO 2 concentration was 1.3 °C when the absolute humidity of the
atmosphere remained constant, but reached 2.4 °C in case of
constant relative humidity. Numerous other studies have
confirmed the crucial importance of feedback mechanisms
on the magnitude of global warming: they can amplify twice
to four times the temperature variation compared to the situation where no feedback is taken into account. These
studies have also shown that the magnitude of these feedbacks is strongly dependent on complex physical processes
(less understood than radiative transfer), such as turbulence,
convection, cloud formation and precipitation (Ramanathan
and Coakley 1978). These processes, and in particular, the
atmospheric circulation which determines how energy and
Table 31.1 Sea level rise from
different sources, adapted from
IPCC (2013), Chapter 13, with
additional data from WCRP
Global Sea Level Budget Group
(2018). The percentages are
relative to the sum of
contributions
Components
Sea level
rise (mm/yr)
1993–2010
(IPCC,
2013)
Sea level rise (mm/yr)
1993–2017
(WCRP Global Sea Level
Budget Group, 2018)
Sea level rise (mm/yr)
2005–2017
(WCRP Global Sea Level
Budget Group, 2018)
1. Thermal expansion
1.1 ± 0.2
1.3 ± 0.4 (48%)
1.3 ± 0.4 (44%)
2. Glaciers (excluding
Greenland and Antarctica)
0.76 ± 0.37
0.65 ± 0.15 (24%)
0.74 ± 0.1 (25%)
3. Greenland ice sheet
0.33 ± 0.08
0.48 ± 0.10 (18%)
0.76 ± 0.1 (26%)
4. Antarctic ice-sheet
0.27 ± 0.11
0.25 ± 0.10 (9%)
0.42 ± 0.1 (14%)
5. Land water storage
0.38 ± 0.11
/
−0.27 ± 0.15 (−9%)
Total of contributions (1 + 2
+3 + 4 + 5)
2.8 ± 0.5
2.7 ± 0.23
2.95 ± 0.21
Observed global mean sea
level rise
3.2 ± 0.4
3.07 ± 0.37
3.5 ± 0.2
Thermal
expansion + GRACE-based
ocean mass
3.6 ± 0.4
31 From the Climates of the Past to the Climates …
459