

data is estimated at 1.7 ± 0.2 mm/yr between 1901 and
2010 for a total sea level rise of 0.19 ± 0.02 m (IPCC
2013).
Since 1992 and the launch of the TOPEX/Poseidon
satellite, altimetric data have provided a new way of estimating sea-level variations, based on the time required for
the round trip of the radar wave and on the satellite altitude
defined above a standard reference surface. These measurements are thus independent on the vertical land motion,
in spite of a small correction (around 0.3 mm/year) to
account for the change in the reference level at the ocean
bottom due to the post-glacial rebound (Peltier et al., 2015).
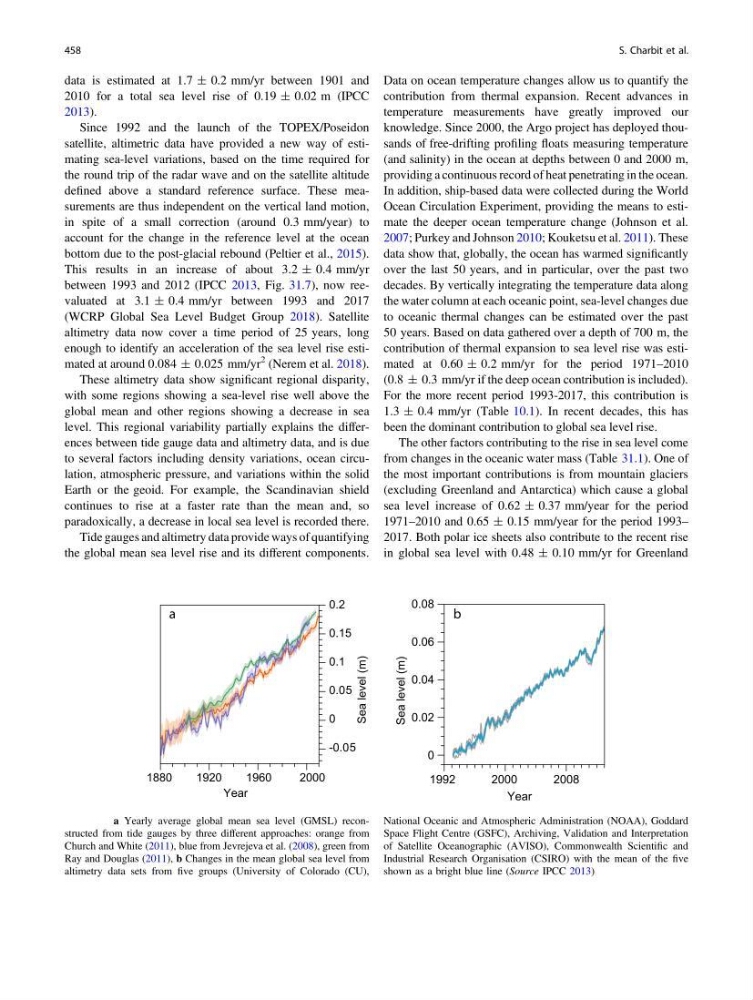
This results in an increase of about 3.2 ± 0.4 mm/yr
between 1993 and 2012 (IPCC 2013, Fig. 31.7), now reevaluated at 3.1 ± 0.4 mm/yr between 1993 and 2017
(WCRP Global Sea Level Budget Group 2018). Satellite
altimetry data now cover a time period of 25 years, long
enough to identify an acceleration of the sea level rise estimated at around 0.084 ± 0.025 mm/yr
2 (Nerem et al. 2018).
These altimetry data show significant regional disparity,
with some regions showing a sea-level rise well above the
global mean and other regions showing a decrease in sea
level. This regional variability partially explains the differences between tide gauge data and altimetry data, and is due
to several factors including density variations, ocean circulation, atmospheric pressure, and variations within the solid
Earth or the geoid. For example, the Scandinavian shield
continues to rise at a faster rate than the mean and, so
paradoxically, a decrease in local sea level is recorded there.
Tide gauges and altimetry data provide ways of quantifying
the global mean sea level rise and its different components.
Data on ocean temperature changes allow us to quantify the
contribution from thermal expansion. Recent advances in
temperature measurements have greatly improved our
knowledge. Since 2000, the Argo project has deployed thousands of free-drifting profiling floats measuring temperature
(and salinity) in the ocean at depths between 0 and 2000 m,
providing a continuous record of heat penetrating in the ocean.
In addition, ship-based data were collected during the World
Ocean Circulation Experiment, providing the means to estimate the deeper ocean temperature change (Johnson et al.
2007; Purkey and Johnson 2010; Kouketsu et al. 2011). These
data show that, globally, the ocean has warmed significantly
over the last 50 years, and in particular, over the past two
decades. By vertically integrating the temperature data along
the water column at each oceanic point, sea-level changes due
to oceanic thermal changes can be estimated over the past
50 years. Based on data gathered over a depth of 700 m, the
contribution of thermal expansion to sea level rise was estimated at 0.60 ± 0.2 mm/yr for the period 1971–2010
(0.8 ± 0.3 mm/yr if the deep ocean contribution is included).
For the more recent period 1993-2017, this contribution is
1.3 ± 0.4 mm/yr (Table 10.1). In recent decades, this has
been the dominant contribution to global sea level rise.
The other factors contributing to the rise in sea level come
from changes in the oceanic water mass (Table 31.1). One of
the most important contributions is from mountain glaciers
(excluding Greenland and Antarctica) which cause a global
sea level increase of 0.62 ± 0.37 mm/year for the period
1971–2010 and 0.65 ± 0.15 mm/year for the period 1993–
2017. Both polar ice sheets also contribute to the recent rise
in global sea level with 0.48 ± 0.10 mm/yr for Greenland
Fig. 31.7 a Yearly average global mean sea level (GMSL) reconstructed from tide gauges by three different approaches: orange from
Church and White (2011), blue from Jevrejeva et al. (2008), green from
Ray and Douglas (2011), b Changes in the mean global sea level from
altimetry data sets from five groups (University of Colorado (CU),
National Oceanic and Atmospheric Administration (NOAA), Goddard
Space Flight Centre (GSFC), Archiving, Validation and Interpretation
of Satellite Oceanographic (AVISO), Commonwealth Scientific and
Industrial Research Organisation (CSIRO) with the mean of the five
shown as a bright blue line (Source IPCC 2013)
458
S. Charbit et al.
2010 for a total sea level rise of 0.19 ± 0.02 m (IPCC
2013).
Since 1992 and the launch of the TOPEX/Poseidon
satellite, altimetric data have provided a new way of estimating sea-level variations, based on the time required for
the round trip of the radar wave and on the satellite altitude
defined above a standard reference surface. These measurements are thus independent on the vertical land motion,
in spite of a small correction (around 0.3 mm/year) to
account for the change in the reference level at the ocean
bottom due to the post-glacial rebound (Peltier et al., 2015).
This results in an increase of about 3.2 ± 0.4 mm/yr
between 1993 and 2012 (IPCC 2013, Fig. 31.7), now reevaluated at 3.1 ± 0.4 mm/yr between 1993 and 2017
(WCRP Global Sea Level Budget Group 2018). Satellite
altimetry data now cover a time period of 25 years, long
enough to identify an acceleration of the sea level rise estimated at around 0.084 ± 0.025 mm/yr
2 (Nerem et al. 2018).
These altimetry data show significant regional disparity,
with some regions showing a sea-level rise well above the
global mean and other regions showing a decrease in sea
level. This regional variability partially explains the differences between tide gauge data and altimetry data, and is due
to several factors including density variations, ocean circulation, atmospheric pressure, and variations within the solid
Earth or the geoid. For example, the Scandinavian shield
continues to rise at a faster rate than the mean and, so
paradoxically, a decrease in local sea level is recorded there.
Tide gauges and altimetry data provide ways of quantifying
the global mean sea level rise and its different components.
Data on ocean temperature changes allow us to quantify the
contribution from thermal expansion. Recent advances in
temperature measurements have greatly improved our
knowledge. Since 2000, the Argo project has deployed thousands of free-drifting profiling floats measuring temperature
(and salinity) in the ocean at depths between 0 and 2000 m,
providing a continuous record of heat penetrating in the ocean.
In addition, ship-based data were collected during the World
Ocean Circulation Experiment, providing the means to estimate the deeper ocean temperature change (Johnson et al.
2007; Purkey and Johnson 2010; Kouketsu et al. 2011). These
data show that, globally, the ocean has warmed significantly
over the last 50 years, and in particular, over the past two
decades. By vertically integrating the temperature data along
the water column at each oceanic point, sea-level changes due
to oceanic thermal changes can be estimated over the past
50 years. Based on data gathered over a depth of 700 m, the
contribution of thermal expansion to sea level rise was estimated at 0.60 ± 0.2 mm/yr for the period 1971–2010
(0.8 ± 0.3 mm/yr if the deep ocean contribution is included).
For the more recent period 1993-2017, this contribution is
1.3 ± 0.4 mm/yr (Table 10.1). In recent decades, this has
been the dominant contribution to global sea level rise.
The other factors contributing to the rise in sea level come
from changes in the oceanic water mass (Table 31.1). One of
the most important contributions is from mountain glaciers
(excluding Greenland and Antarctica) which cause a global
sea level increase of 0.62 ± 0.37 mm/year for the period
1971–2010 and 0.65 ± 0.15 mm/year for the period 1993–
2017. Both polar ice sheets also contribute to the recent rise
in global sea level with 0.48 ± 0.10 mm/yr for Greenland
Fig. 31.7 a Yearly average global mean sea level (GMSL) reconstructed from tide gauges by three different approaches: orange from
Church and White (2011), blue from Jevrejeva et al. (2008), green from
Ray and Douglas (2011), b Changes in the mean global sea level from
altimetry data sets from five groups (University of Colorado (CU),
National Oceanic and Atmospheric Administration (NOAA), Goddard
Space Flight Centre (GSFC), Archiving, Validation and Interpretation
of Satellite Oceanographic (AVISO), Commonwealth Scientific and
Industrial Research Organisation (CSIRO) with the mean of the five
shown as a bright blue line (Source IPCC 2013)
458
S. Charbit et al.