

water vapor between the atmosphere and ocean which can
affect local cloud cover and precipitation rate.
The extent (i.e. area of the sea covered by sea ice), and
the thickness of sea ice are the two indicators of sea ice
conditions. Typically, the average sea-ice extent ranges from
14 to 16 Â 10
6 km
2 at the end of winter (7 to 9 Â 10
6 km
2
at the end of summer) for the Arctic and from 17 to
20 Â 10
6 km
2 (3 to 4 Â 10
6 km
2 at the end of summer) for
Antarctica. The first systematic monitoring of sea ice conditions began in 1972 with the first satellite observations. For
older periods, only a few scattered data are available. Most
of the analysis of the variability and trends in sea ice cover
relates to the post-1978 period. The results from different
types of satellites give very consistent results, and all highlight an asymmetry between the Arctic and the Austral
Ocean, with a clear decreasing trend for the Arctic and a
slight growth for Antarctica, although the latter trend is not
statistically significant.
Before the satellite era, sea-ice data are relatively sparse
and inconsistent. Nevertheless, although these data indicate
significant regional variability, all confirm an increase in
sea-ice cover during the nineteenth century and the first half
of the twentieth century, and a sharp decline in sea ice from
1970 onwards. According to the assessment by the National
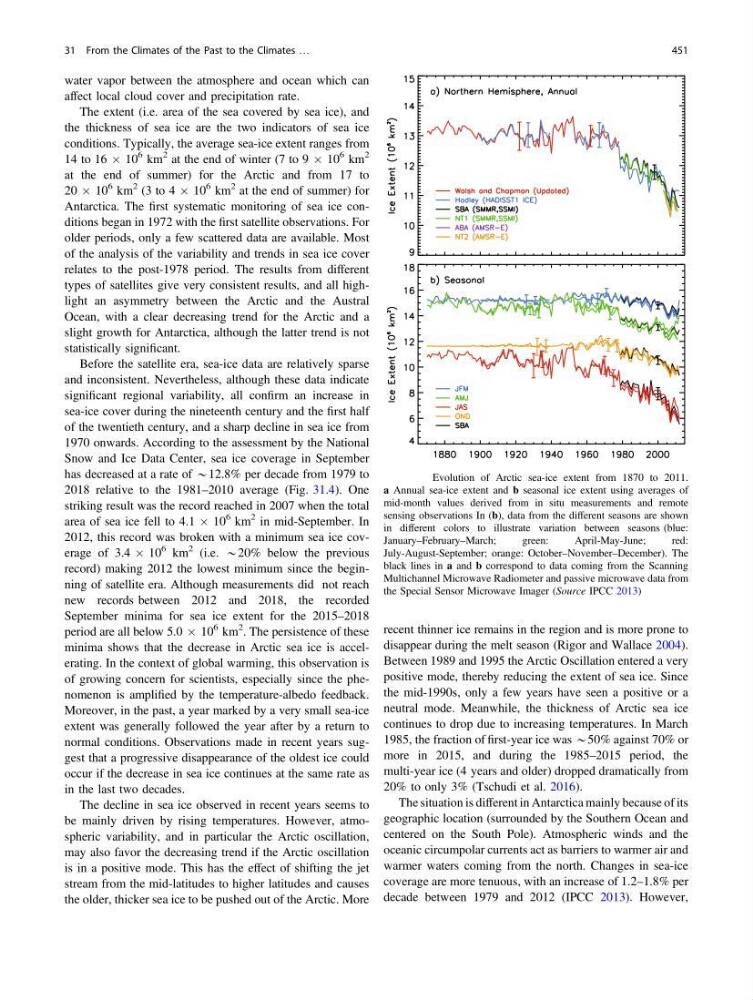
Snow and Ice Data Center, sea ice coverage in September
has decreased at a rate of *12.8% per decade from 1979 to
2018 relative to the 1981–2010 average (Fig. 31.4). One
striking result was the record reached in 2007 when the total
area of sea ice fell to 4.1 Â 10
6 km
2 in mid-September. In
2012, this record was broken with a minimum sea ice coverage of 3.4 Â 10
6 km
2 (i.e. *20% below the previous
record) making 2012 the lowest minimum since the beginning of satellite era. Although measurements did not reach
new records between 2012 and 2018, the recorded
September minima for sea ice extent for the 2015–2018
period are all below 5.0 Â 10
6 km
2 . The persistence of these
minima shows that the decrease in Arctic sea ice is accelerating. In the context of global warming, this observation is
of growing concern for scientists, especially since the phenomenon is amplified by the temperature-albedo feedback.
Moreover, in the past, a year marked by a very small sea-ice
extent was generally followed the year after by a return to
normal conditions. Observations made in recent years suggest that a progressive disappearance of the oldest ice could
occur if the decrease in sea ice continues at the same rate as
in the last two decades.
The decline in sea ice observed in recent years seems to
be mainly driven by rising temperatures. However, atmospheric variability, and in particular the Arctic oscillation,
may also favor the decreasing trend if the Arctic oscillation
is in a positive mode. This has the effect of shifting the jet
stream from the mid-latitudes to higher latitudes and causes
the older, thicker sea ice to be pushed out of the Arctic. More
recent thinner ice remains in the region and is more prone to
disappear during the melt season (Rigor and Wallace 2004).
Between 1989 and 1995 the Arctic Oscillation entered a very
positive mode, thereby reducing the extent of sea ice. Since
the mid-1990s, only a few years have seen a positive or a
neutral mode. Meanwhile, the thickness of Arctic sea ice
continues to drop due to increasing temperatures. In March
1985, the fraction of first-year ice was *50% against 70% or
more in 2015, and during the 1985–2015 period, the
multi-year ice (4 years and older) dropped dramatically from
20% to only 3% (Tschudi et al. 2016).
The situation is different in Antarctica mainly because of its
geographic location (surrounded by the Southern Ocean and
centered on the South Pole). Atmospheric winds and the
oceanic circumpolar currents act as barriers to warmer air and
warmer waters coming from the north. Changes in sea-ice
coverage are more tenuous, with an increase of 1.2–1.8% per
decade between 1979 and 2012 (IPCC 2013). However,
Fig. 31.4 Evolution of Arctic sea-ice extent from 1870 to 2011.
a Annual sea-ice extent and b seasonal ice extent using averages of
mid-month values derived from in situ measurements and remote
sensing observations In (b), data from the different seasons are shown
in different colors to illustrate variation between seasons (blue:
January–February–March;
green:
April-May-June;
red:
July-August-September; orange: October–November–December). The
black lines in a and b correspond to data coming from the Scanning
Multichannel Microwave Radiometer and passive microwave data from
the Special Sensor Microwave Imager (Source IPCC 2013)
31 From the Climates of the Past to the Climates …
451
affect local cloud cover and precipitation rate.
The extent (i.e. area of the sea covered by sea ice), and
the thickness of sea ice are the two indicators of sea ice
conditions. Typically, the average sea-ice extent ranges from
14 to 16 Â 10
6 km
2 at the end of winter (7 to 9 Â 10
6 km
2
at the end of summer) for the Arctic and from 17 to
20 Â 10
6 km
2 (3 to 4 Â 10
6 km
2 at the end of summer) for
Antarctica. The first systematic monitoring of sea ice conditions began in 1972 with the first satellite observations. For
older periods, only a few scattered data are available. Most
of the analysis of the variability and trends in sea ice cover
relates to the post-1978 period. The results from different
types of satellites give very consistent results, and all highlight an asymmetry between the Arctic and the Austral
Ocean, with a clear decreasing trend for the Arctic and a
slight growth for Antarctica, although the latter trend is not
statistically significant.
Before the satellite era, sea-ice data are relatively sparse
and inconsistent. Nevertheless, although these data indicate
significant regional variability, all confirm an increase in
sea-ice cover during the nineteenth century and the first half
of the twentieth century, and a sharp decline in sea ice from
1970 onwards. According to the assessment by the National
Snow and Ice Data Center, sea ice coverage in September
has decreased at a rate of *12.8% per decade from 1979 to
2018 relative to the 1981–2010 average (Fig. 31.4). One
striking result was the record reached in 2007 when the total
area of sea ice fell to 4.1 Â 10
6 km
2 in mid-September. In
2012, this record was broken with a minimum sea ice coverage of 3.4 Â 10
6 km
2 (i.e. *20% below the previous
record) making 2012 the lowest minimum since the beginning of satellite era. Although measurements did not reach
new records between 2012 and 2018, the recorded
September minima for sea ice extent for the 2015–2018
period are all below 5.0 Â 10
6 km
2 . The persistence of these
minima shows that the decrease in Arctic sea ice is accelerating. In the context of global warming, this observation is
of growing concern for scientists, especially since the phenomenon is amplified by the temperature-albedo feedback.
Moreover, in the past, a year marked by a very small sea-ice
extent was generally followed the year after by a return to
normal conditions. Observations made in recent years suggest that a progressive disappearance of the oldest ice could
occur if the decrease in sea ice continues at the same rate as
in the last two decades.
The decline in sea ice observed in recent years seems to
be mainly driven by rising temperatures. However, atmospheric variability, and in particular the Arctic oscillation,
may also favor the decreasing trend if the Arctic oscillation
is in a positive mode. This has the effect of shifting the jet
stream from the mid-latitudes to higher latitudes and causes
the older, thicker sea ice to be pushed out of the Arctic. More
recent thinner ice remains in the region and is more prone to
disappear during the melt season (Rigor and Wallace 2004).
Between 1989 and 1995 the Arctic Oscillation entered a very
positive mode, thereby reducing the extent of sea ice. Since
the mid-1990s, only a few years have seen a positive or a
neutral mode. Meanwhile, the thickness of Arctic sea ice
continues to drop due to increasing temperatures. In March
1985, the fraction of first-year ice was *50% against 70% or
more in 2015, and during the 1985–2015 period, the
multi-year ice (4 years and older) dropped dramatically from
20% to only 3% (Tschudi et al. 2016).
The situation is different in Antarctica mainly because of its
geographic location (surrounded by the Southern Ocean and
centered on the South Pole). Atmospheric winds and the
oceanic circumpolar currents act as barriers to warmer air and
warmer waters coming from the north. Changes in sea-ice
coverage are more tenuous, with an increase of 1.2–1.8% per
decade between 1979 and 2012 (IPCC 2013). However,
Fig. 31.4 Evolution of Arctic sea-ice extent from 1870 to 2011.
a Annual sea-ice extent and b seasonal ice extent using averages of
mid-month values derived from in situ measurements and remote
sensing observations In (b), data from the different seasons are shown
in different colors to illustrate variation between seasons (blue:
January–February–March;
green:
April-May-June;
red:
July-August-September; orange: October–November–December). The
black lines in a and b correspond to data coming from the Scanning
Multichannel Microwave Radiometer and passive microwave data from
the Special Sensor Microwave Imager (Source IPCC 2013)
31 From the Climates of the Past to the Climates …
451