

generally, global warming is a long-term process that is
superimposed on the internal climate variability, and it
remains possible to have occasional short-term cooling trends
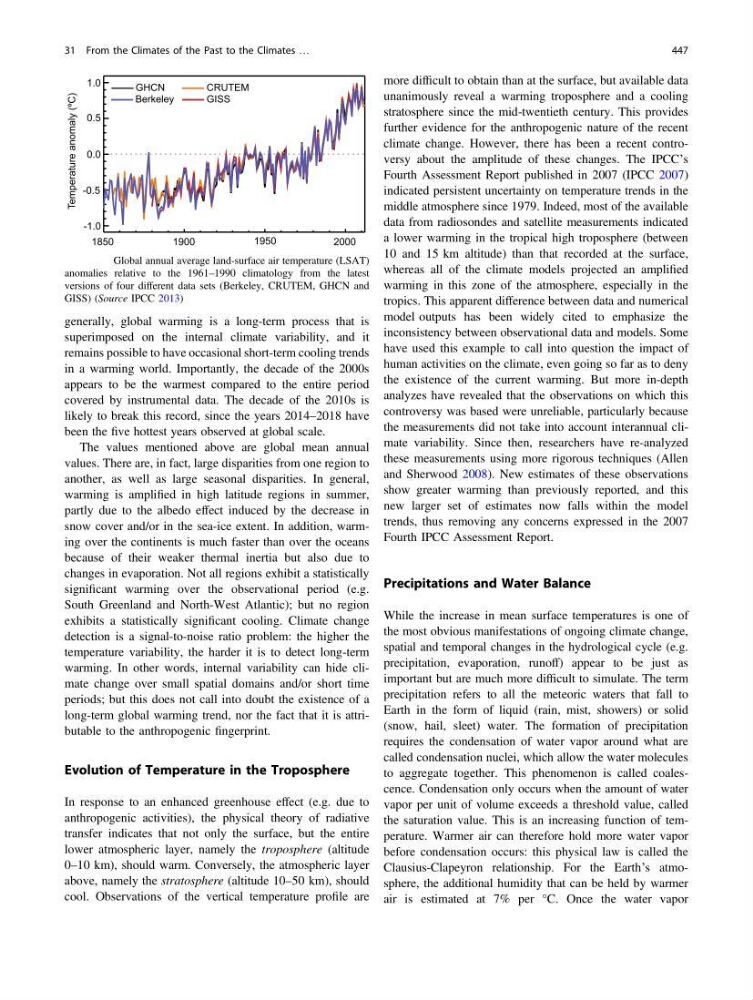
in a warming world. Importantly, the decade of the 2000s
appears to be the warmest compared to the entire period
covered by instrumental data. The decade of the 2010s is
likely to break this record, since the years 2014–2018 have
been the five hottest years observed at global scale.
The values mentioned above are global mean annual
values. There are, in fact, large disparities from one region to
another, as well as large seasonal disparities. In general,
warming is amplified in high latitude regions in summer,
partly due to the albedo effect induced by the decrease in
snow cover and/or in the sea-ice extent. In addition, warming over the continents is much faster than over the oceans
because of their weaker thermal inertia but also due to
changes in evaporation. Not all regions exhibit a statistically
significant warming over the observational period (e.g.
South Greenland and North-West Atlantic); but no region
exhibits a statistically significant cooling. Climate change
detection is a signal-to-noise ratio problem: the higher the
temperature variability, the harder it is to detect long-term
warming. In other words, internal variability can hide climate change over small spatial domains and/or short time
periods; but this does not call into doubt the existence of a
long-term global warming trend, nor the fact that it is attributable to the anthropogenic fingerprint.
Evolution of Temperature in the Troposphere
In response to an enhanced greenhouse effect (e.g. due to
anthropogenic activities), the physical theory of radiative
transfer indicates that not only the surface, but the entire
lower atmospheric layer, namely the troposphere (altitude
0–10 km), should warm. Conversely, the atmospheric layer
above, namely the stratosphere (altitude 10–50 km), should
cool. Observations of the vertical temperature profile are
more difficult to obtain than at the surface, but available data
unanimously reveal a warming troposphere and a cooling
stratosphere since the mid-twentieth century. This provides
further evidence for the anthropogenic nature of the recent
climate change. However, there has been a recent controversy about the amplitude of these changes. The IPCC’s
Fourth Assessment Report published in 2007 (IPCC 2007)
indicated persistent uncertainty on temperature trends in the
middle atmosphere since 1979. Indeed, most of the available
data from radiosondes and satellite measurements indicated
a lower warming in the tropical high troposphere (between
10 and 15 km altitude) than that recorded at the surface,
whereas all of the climate models projected an amplified
warming in this zone of the atmosphere, especially in the
tropics. This apparent difference between data and numerical
model outputs has been widely cited to emphasize the
inconsistency between observational data and models. Some
have used this example to call into question the impact of
human activities on the climate, even going so far as to deny
the existence of the current warming. But more in-depth
analyzes have revealed that the observations on which this
controversy was based were unreliable, particularly because
the measurements did not take into account interannual climate variability. Since then, researchers have re-analyzed
these measurements using more rigorous techniques (Allen
and Sherwood 2008). New estimates of these observations
show greater warming than previously reported, and this
new larger set of estimates now falls within the model
trends, thus removing any concerns expressed in the 2007
Fourth IPCC Assessment Report.
Precipitations and Water Balance
While the increase in mean surface temperatures is one of
the most obvious manifestations of ongoing climate change,
spatial and temporal changes in the hydrological cycle (e.g.
precipitation, evaporation, runoff) appear to be just as
important but are much more difficult to simulate. The term
precipitation refers to all the meteoric waters that fall to
Earth in the form of liquid (rain, mist, showers) or solid
(snow, hail, sleet) water. The formation of precipitation
requires the condensation of water vapor around what are
called condensation nuclei, which allow the water molecules
to aggregate together. This phenomenon is called coalescence. Condensation only occurs when the amount of water
vapor per unit of volume exceeds a threshold value, called
the saturation value. This is an increasing function of temperature. Warmer air can therefore hold more water vapor
before condensation occurs: this physical law is called the
Clausius-Clapeyron relationship. For the Earth’s atmosphere, the additional humidity that can be held by warmer
air is estimated at 7% per °C. Once the water vapor
Fig. 31.3 Global annual average land-surface air temperature (LSAT)
anomalies relative to the 1961–1990 climatology from the latest
versions of four different data sets (Berkeley, CRUTEM, GHCN and
GISS) (Source IPCC 2013)
31 From the Climates of the Past to the Climates …
447
superimposed on the internal climate variability, and it
remains possible to have occasional short-term cooling trends
in a warming world. Importantly, the decade of the 2000s
appears to be the warmest compared to the entire period
covered by instrumental data. The decade of the 2010s is
likely to break this record, since the years 2014–2018 have
been the five hottest years observed at global scale.
The values mentioned above are global mean annual
values. There are, in fact, large disparities from one region to
another, as well as large seasonal disparities. In general,
warming is amplified in high latitude regions in summer,
partly due to the albedo effect induced by the decrease in
snow cover and/or in the sea-ice extent. In addition, warming over the continents is much faster than over the oceans
because of their weaker thermal inertia but also due to
changes in evaporation. Not all regions exhibit a statistically
significant warming over the observational period (e.g.
South Greenland and North-West Atlantic); but no region
exhibits a statistically significant cooling. Climate change
detection is a signal-to-noise ratio problem: the higher the
temperature variability, the harder it is to detect long-term
warming. In other words, internal variability can hide climate change over small spatial domains and/or short time
periods; but this does not call into doubt the existence of a
long-term global warming trend, nor the fact that it is attributable to the anthropogenic fingerprint.
Evolution of Temperature in the Troposphere
In response to an enhanced greenhouse effect (e.g. due to
anthropogenic activities), the physical theory of radiative
transfer indicates that not only the surface, but the entire
lower atmospheric layer, namely the troposphere (altitude
0–10 km), should warm. Conversely, the atmospheric layer
above, namely the stratosphere (altitude 10–50 km), should
cool. Observations of the vertical temperature profile are
more difficult to obtain than at the surface, but available data
unanimously reveal a warming troposphere and a cooling
stratosphere since the mid-twentieth century. This provides
further evidence for the anthropogenic nature of the recent
climate change. However, there has been a recent controversy about the amplitude of these changes. The IPCC’s
Fourth Assessment Report published in 2007 (IPCC 2007)
indicated persistent uncertainty on temperature trends in the
middle atmosphere since 1979. Indeed, most of the available
data from radiosondes and satellite measurements indicated
a lower warming in the tropical high troposphere (between
10 and 15 km altitude) than that recorded at the surface,
whereas all of the climate models projected an amplified
warming in this zone of the atmosphere, especially in the
tropics. This apparent difference between data and numerical
model outputs has been widely cited to emphasize the
inconsistency between observational data and models. Some
have used this example to call into question the impact of
human activities on the climate, even going so far as to deny
the existence of the current warming. But more in-depth
analyzes have revealed that the observations on which this
controversy was based were unreliable, particularly because
the measurements did not take into account interannual climate variability. Since then, researchers have re-analyzed
these measurements using more rigorous techniques (Allen
and Sherwood 2008). New estimates of these observations
show greater warming than previously reported, and this
new larger set of estimates now falls within the model
trends, thus removing any concerns expressed in the 2007
Fourth IPCC Assessment Report.
Precipitations and Water Balance
While the increase in mean surface temperatures is one of
the most obvious manifestations of ongoing climate change,
spatial and temporal changes in the hydrological cycle (e.g.
precipitation, evaporation, runoff) appear to be just as
important but are much more difficult to simulate. The term
precipitation refers to all the meteoric waters that fall to
Earth in the form of liquid (rain, mist, showers) or solid
(snow, hail, sleet) water. The formation of precipitation
requires the condensation of water vapor around what are
called condensation nuclei, which allow the water molecules
to aggregate together. This phenomenon is called coalescence. Condensation only occurs when the amount of water
vapor per unit of volume exceeds a threshold value, called
the saturation value. This is an increasing function of temperature. Warmer air can therefore hold more water vapor
before condensation occurs: this physical law is called the
Clausius-Clapeyron relationship. For the Earth’s atmosphere, the additional humidity that can be held by warmer
air is estimated at 7% per °C. Once the water vapor
Fig. 31.3 Global annual average land-surface air temperature (LSAT)
anomalies relative to the 1961–1990 climatology from the latest
versions of four different data sets (Berkeley, CRUTEM, GHCN and
GISS) (Source IPCC 2013)
31 From the Climates of the Past to the Climates …
447