

per year during the 1970s and early 1980s, the 1990s and
early 2000s saw this rate stabilize, resulting in relatively
stable concentrations. However, atmospheric CH 4 concentrations started growing again from 2007, although the true
cause of this renewed increase is still unclear. CH 4 is emitted
by many agricultural activities (ruminant farming, rice cultivation), by industrial activities (biomass combustion, the
oil and gas industry), as well as by natural processes (wetlands, permafrost, peat bogs). There are no available data on
annual CH 4 emissions from industrial activities as these are
difficult to quantify. When the climate warms up, CH 4
emissions from natural processes can increase. This has been
observed with permafrost thawing in Sweden, but no
large-scale evidence is available to clearly relate this process
to the recent increase in methane. If the observed increase is
caused by the response of natural reservoirs to global
warming, this could last for several decades, even centuries,
and thus reinforce the enhanced greenhouse effect (positive
feedback).
The greenhouse gas with the fourth contribution to
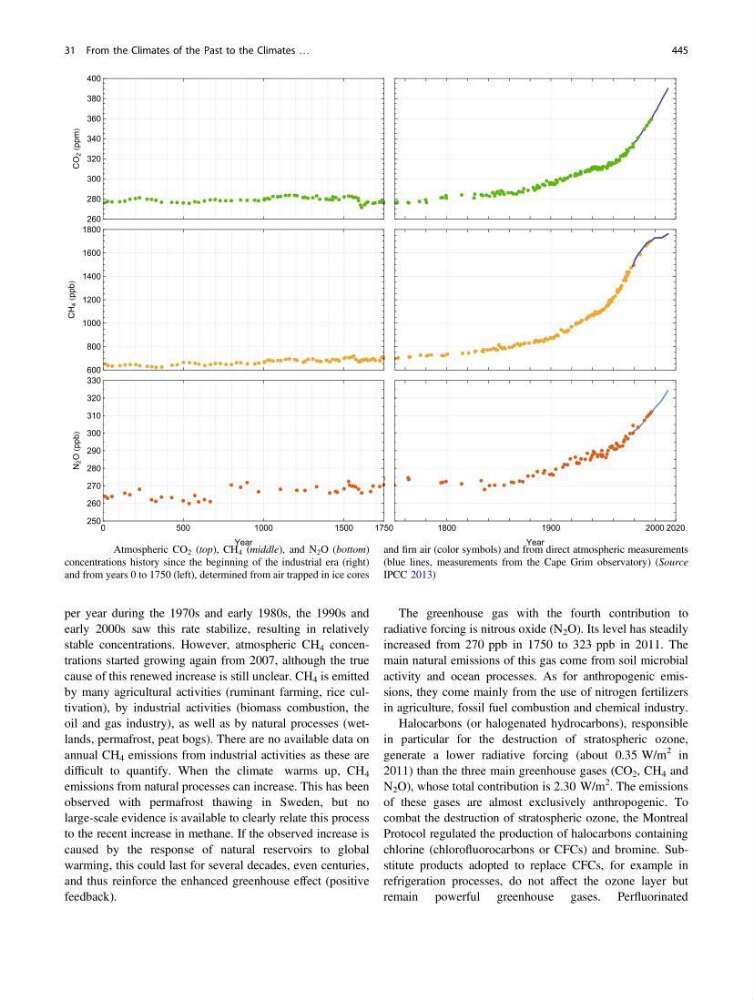
radiative forcing is nitrous oxide (N 2 O). Its level has steadily
increased from 270 ppb in 1750 to 323 ppb in 2011. The
main natural emissions of this gas come from soil microbial
activity and ocean processes. As for anthropogenic emissions, they come mainly from the use of nitrogen fertilizers
in agriculture, fossil fuel combustion and chemical industry.
Halocarbons (or halogenated hydrocarbons), responsible
in particular for the destruction of stratospheric ozone,
generate a lower radiative forcing (about 0.35 W/m
2 in
2011) than the three main greenhouse gases (CO 2 , CH 4 and
N 2 O), whose total contribution is 2.30 W/m
2 . The emissions
of these gases are almost exclusively anthropogenic. To
combat the destruction of stratospheric ozone, the Montreal
Protocol regulated the production of halocarbons containing
chlorine (chlorofluorocarbons or CFCs) and bromine. Substitute products adopted to replace CFCs, for example in
refrigeration processes, do not affect the ozone layer but
remain powerful greenhouse gases. Perfluorinated
Fig. 31.1 Atmospheric CO 2 (top), CH 4 (middle), and N 2 O (bottom)
concentrations history since the beginning of the industrial era (right)
and from years 0 to 1750 (left), determined from air trapped in ice cores
and firn air (color symbols) and from direct atmospheric measurements
(blue lines, measurements from the Cape Grim observatory) (Source
IPCC 2013)
31 From the Climates of the Past to the Climates …
445
early 2000s saw this rate stabilize, resulting in relatively
stable concentrations. However, atmospheric CH 4 concentrations started growing again from 2007, although the true
cause of this renewed increase is still unclear. CH 4 is emitted
by many agricultural activities (ruminant farming, rice cultivation), by industrial activities (biomass combustion, the
oil and gas industry), as well as by natural processes (wetlands, permafrost, peat bogs). There are no available data on
annual CH 4 emissions from industrial activities as these are
difficult to quantify. When the climate warms up, CH 4
emissions from natural processes can increase. This has been
observed with permafrost thawing in Sweden, but no
large-scale evidence is available to clearly relate this process
to the recent increase in methane. If the observed increase is
caused by the response of natural reservoirs to global
warming, this could last for several decades, even centuries,
and thus reinforce the enhanced greenhouse effect (positive
feedback).
The greenhouse gas with the fourth contribution to
radiative forcing is nitrous oxide (N 2 O). Its level has steadily
increased from 270 ppb in 1750 to 323 ppb in 2011. The
main natural emissions of this gas come from soil microbial
activity and ocean processes. As for anthropogenic emissions, they come mainly from the use of nitrogen fertilizers
in agriculture, fossil fuel combustion and chemical industry.
Halocarbons (or halogenated hydrocarbons), responsible
in particular for the destruction of stratospheric ozone,
generate a lower radiative forcing (about 0.35 W/m
2 in
2011) than the three main greenhouse gases (CO 2 , CH 4 and
N 2 O), whose total contribution is 2.30 W/m
2 . The emissions
of these gases are almost exclusively anthropogenic. To
combat the destruction of stratospheric ozone, the Montreal
Protocol regulated the production of halocarbons containing
chlorine (chlorofluorocarbons or CFCs) and bromine. Substitute products adopted to replace CFCs, for example in
refrigeration processes, do not affect the ozone layer but
remain powerful greenhouse gases. Perfluorinated
Fig. 31.1 Atmospheric CO 2 (top), CH 4 (middle), and N 2 O (bottom)
concentrations history since the beginning of the industrial era (right)
and from years 0 to 1750 (left), determined from air trapped in ice cores
and firn air (color symbols) and from direct atmospheric measurements
(blue lines, measurements from the Cape Grim observatory) (Source
IPCC 2013)
31 From the Climates of the Past to the Climates …
445