

Estimates of the forcings induced by changes in the solar
constant and volcanism are more open to controversy
because they are more difficult to measure directly. Estimates from satellite data suggest that the differences between
periods of solar activity and inactivity are due to fluctuations
of about 0.08% in solar irradiance (1 965 W/m
2 ) over the
last twenty years. For older periods, cosmogenic isotopes,
the number of sunspots and observations of the aurora
borealis are all indicators of solar activity (see Chap. 1,
Volume 1). The amplitude of solar variations over the last
millennium has recently been revised downwards and current best estimates suggest an increase of between 0.05 and
1.2% in solar irradiance between the Maunder minimum
(between 1650 and 1720) and the current period, which
corresponds to a radiative disturbance of 0.1 to 0.3 W/m
2 .
Very intense volcanic eruptions introduce sulfate aerosols
into the stratosphere, which reflect back solar radiation and
thus contribute to a cooling of the climate in the year following the eruption.
There are many proofs of volcanic activity during the
Holocene, but there is no quantified series for the overall
period. Data has become more accurate for the last century,
although the eruption timing, geographic location and
quantities of aerosols emitted are not known with precision.
Thus, depending on the sources of information, the amplitude and the date of the Holocene eruptions vary greatly.
The Evolution of Temperature in the Various
Records
The recorded variations in temperatures during the Holocene
reflect the response of the climate system to the various
radiative disturbances listed above, as well as other various
feedbacks, such as water vapor and melting snow and ice
caps. The climate optimum at the beginning of the Holocene
did not occur simultaneously at all latitudes (Fig. 30.3), as
insolation depends on latitude and the season and feedbacks
produce a delay between the forcing and its maximum
summer temperatures 10,000–8000 years ago. Reconstructions for the mid-latitudes of the northern hemisphere are
characterized by slow decreases in sea-surface temperature
(SST) during the Holocene. In North America, the hottest
period was between 7000 and 5000 years ago. Pollen data
and macrofossil remains (see Volume 1, Chap. 10 for
methodologies) indicate that temperate forests were found
further north than they are today and that glaciers had
retreated. The early warming at high southern latitudes at the
beginning of the Holocene cannot be explained simply as a
response to local insolation conditions, and appears to be a
manifestation of a large-scale reorganization of atmospheric
and oceanic heat transport. Yet most tropical regions show a
gradual warming during the Holocene, reflecting an increase
in insolation in these regions.
The growing abundance of chronicles relating the impacts
of climate extremes (due to the expansion of humanity)
provides a description of the intra-annual climate variability
over the last 2000 years. This can be superimposed on the
secular fluctuations mentioned above. Figure 30.4 summarizes the current state of knowledge of temperature changes
since the year 700 AD. Taking uncertainties into account,
the temperature of the northern hemisphere is fairly stable
between the year 700 and the end of the nineteenth century,
and begins to increase continuously from the twentieth
century onwards (Fig. 30.4c). The shape of this curve
resembles a hockey stick, hence its iconic name. Excluding
the twentieth century, for which there is an abundance of
meteorological recordings, the value of the curve is that it
shows a relatively warm phase between the year 1000 and
1300 (often called the ‘Medieval Warm Period’) and a relatively cold phase between 1350 and 1850 (called the ‘Little
Ice Age’). The causes of the inter-annual variations in
years
Insolation
years
Seasonal amplitude and month of the maximum
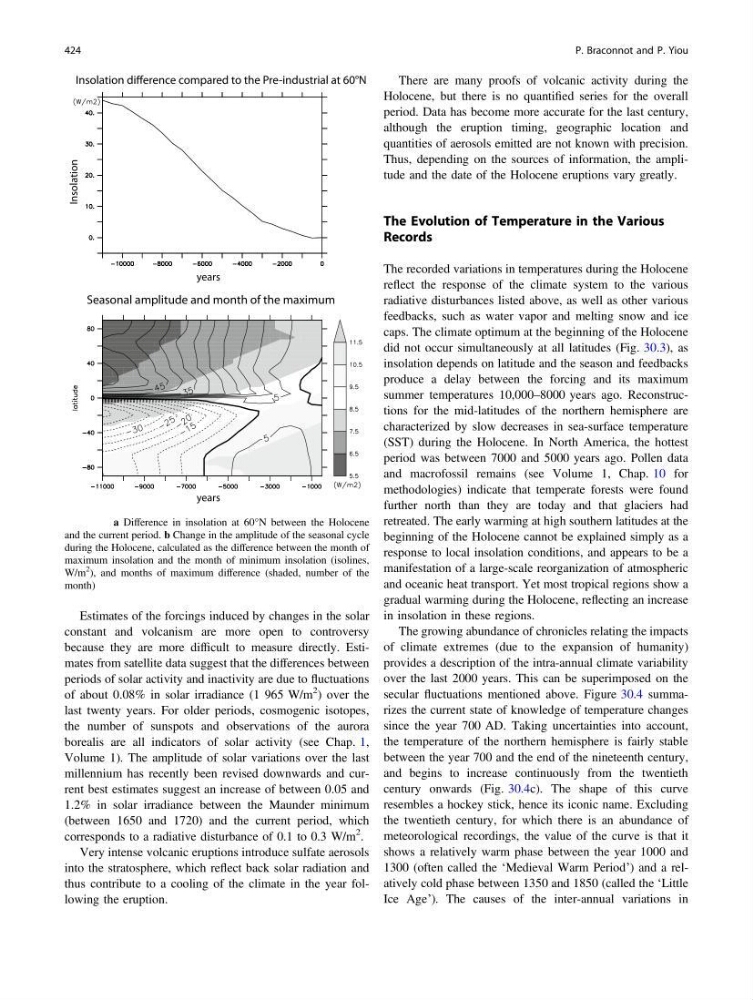
Fig. 30.1 a Difference in insolation at 60°N between the Holocene
and the current period. b Change in the amplitude of the seasonal cycle
during the Holocene, calculated as the difference between the month of
maximum insolation and the month of minimum insolation (isolines,
W/m
2
), and months of maximum difference (shaded, number of the
month)
424
P. Braconnot and P. Yiou
constant and volcanism are more open to controversy
because they are more difficult to measure directly. Estimates from satellite data suggest that the differences between
periods of solar activity and inactivity are due to fluctuations
of about 0.08% in solar irradiance (1 965 W/m
2 ) over the
last twenty years. For older periods, cosmogenic isotopes,
the number of sunspots and observations of the aurora
borealis are all indicators of solar activity (see Chap. 1,
Volume 1). The amplitude of solar variations over the last
millennium has recently been revised downwards and current best estimates suggest an increase of between 0.05 and
1.2% in solar irradiance between the Maunder minimum
(between 1650 and 1720) and the current period, which
corresponds to a radiative disturbance of 0.1 to 0.3 W/m
2 .
Very intense volcanic eruptions introduce sulfate aerosols
into the stratosphere, which reflect back solar radiation and
thus contribute to a cooling of the climate in the year following the eruption.
There are many proofs of volcanic activity during the
Holocene, but there is no quantified series for the overall
period. Data has become more accurate for the last century,
although the eruption timing, geographic location and
quantities of aerosols emitted are not known with precision.
Thus, depending on the sources of information, the amplitude and the date of the Holocene eruptions vary greatly.
The Evolution of Temperature in the Various
Records
The recorded variations in temperatures during the Holocene
reflect the response of the climate system to the various
radiative disturbances listed above, as well as other various
feedbacks, such as water vapor and melting snow and ice
caps. The climate optimum at the beginning of the Holocene
did not occur simultaneously at all latitudes (Fig. 30.3), as
insolation depends on latitude and the season and feedbacks
produce a delay between the forcing and its maximum
summer temperatures 10,000–8000 years ago. Reconstructions for the mid-latitudes of the northern hemisphere are
characterized by slow decreases in sea-surface temperature
(SST) during the Holocene. In North America, the hottest
period was between 7000 and 5000 years ago. Pollen data
and macrofossil remains (see Volume 1, Chap. 10 for
methodologies) indicate that temperate forests were found
further north than they are today and that glaciers had
retreated. The early warming at high southern latitudes at the
beginning of the Holocene cannot be explained simply as a
response to local insolation conditions, and appears to be a
manifestation of a large-scale reorganization of atmospheric
and oceanic heat transport. Yet most tropical regions show a
gradual warming during the Holocene, reflecting an increase
in insolation in these regions.
The growing abundance of chronicles relating the impacts
of climate extremes (due to the expansion of humanity)
provides a description of the intra-annual climate variability
over the last 2000 years. This can be superimposed on the
secular fluctuations mentioned above. Figure 30.4 summarizes the current state of knowledge of temperature changes
since the year 700 AD. Taking uncertainties into account,
the temperature of the northern hemisphere is fairly stable
between the year 700 and the end of the nineteenth century,
and begins to increase continuously from the twentieth
century onwards (Fig. 30.4c). The shape of this curve
resembles a hockey stick, hence its iconic name. Excluding
the twentieth century, for which there is an abundance of
meteorological recordings, the value of the curve is that it
shows a relatively warm phase between the year 1000 and
1300 (often called the ‘Medieval Warm Period’) and a relatively cold phase between 1350 and 1850 (called the ‘Little
Ice Age’). The causes of the inter-annual variations in
years
Insolation
years
Seasonal amplitude and month of the maximum
Fig. 30.1 a Difference in insolation at 60°N between the Holocene
and the current period. b Change in the amplitude of the seasonal cycle
during the Holocene, calculated as the difference between the month of
maximum insolation and the month of minimum insolation (isolines,
W/m
2
), and months of maximum difference (shaded, number of the
month)
424
P. Braconnot and P. Yiou