

in the last phase of the Eocene (Zachos et al. 2008). At the
Eocene-Oligocene transition (34 Ma) a distinct, cold climate
pulse was experienced. The d
18 O data obtained from benthic
foraminifera show a deep-water cooling of about 4 °C
(Fig. 27.3). A permanent Antarctic cap began to emerge
(Zachos et al. 2008).
The second step towards global cooling occurred at the
Oligocene-Miocene boundary (23 Ma). But this cold episode is followed by the Miocene climate optimum between
23 and 15 Ma. The latter is particularly problematic because,
according to the d
11 B and d
13 C data from alkenones,
atmospheric CO 2 pressure should have been low, at around
the present value, or even lower, between 200 and 300 ppmv
(Pagani et al. 1999). The reasons for this climate optimum
are still unknown.
From 15 Ma onwards, the climate cooled rapidly and the
East Antarctic sheet developed. The last stage of cooling,
5 Ma ago, was marked by the establishment of the West
Antarctic ice sheet (Fig. 27.3).
The reasons for this cooling are still in dispute. There are
two opposing theories. According to one, the climate evolution of the Cenozoic was largely driven by the opening of
key ocean passages and the closure of others. According to
the other, it was the drop in CO 2 level that was responsible
for this cooling. From 50 Ma onwards, ocean basins began
to become established in the Drake Passage area, allowing
shallow water exchanges between the Atlantic and Pacific
Oceans. Isotopic analyses of neodymium in deep sediments
indicate that around 41 Ma, the flow of exchanges between
ocean basins intensified around Antarctica (Scher and Martin
2006). The intensification of the rate of expansion of the
seabed in the Drake and the Tasmanian Passages 34 Ma ago,
allowed the Antarctic circumpolar current to become established, definitively isolating the South Pole continent. This
date coincides with a major development phase of the
Antarctic ice cap.
The role of ocean passages in global climate change has
been called into question by modeling studies, which tend to
show that glaciation and the appearance of an ice cap over
Antarctica are mainly associated with a decrease in the level
of CO 2 Lefebvre et al. (2012), see also Chap. 3. It should be
noted, however, that this premise is very poorly documented.
Indeed, this is a period for which d
11 B data are non-existent.
At best, we know that CO 2 levels were around 1000 ppmv
40 Ma ago, and about 300 ppmv 24 Ma ago. These data
suggest decreasing levels of CO 2 although it is not possible
to document the evolution precisely. Nevertheless, DeConto
and Pollard (2003) have shown in a simulation that even
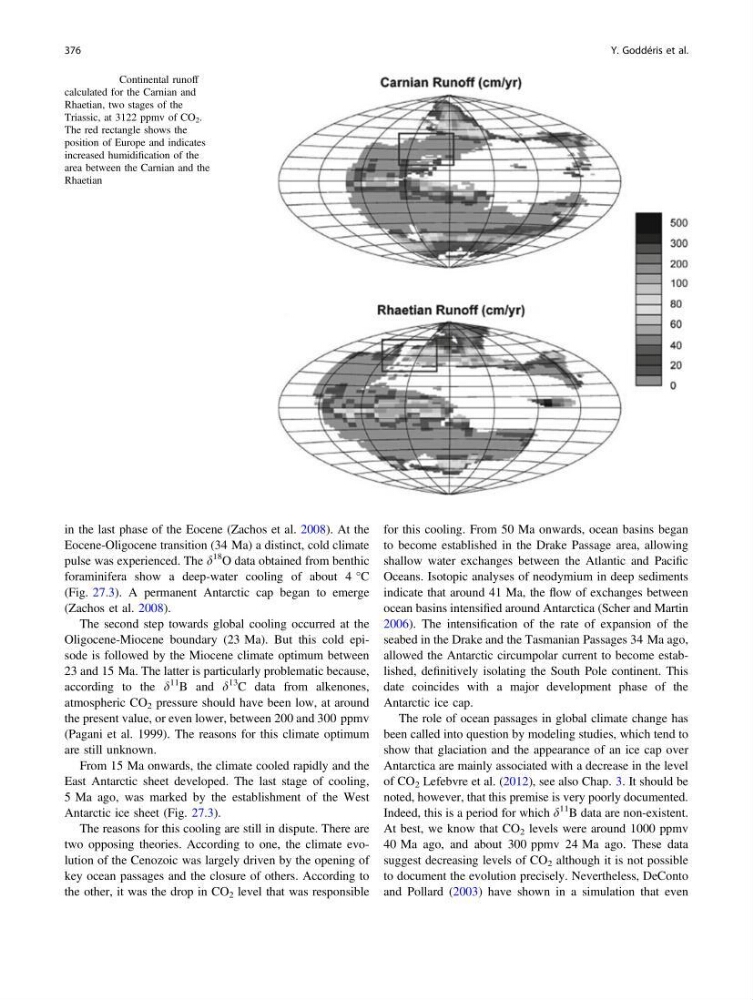
Fig. 27.12 Continental runoff
calculated for the Carnian and
Rhaetian, two stages of the
Triassic, at 3122 ppmv of CO 2 .
The red rectangle shows the
position of Europe and indicates
increased humidification of the
area between the Carnian and the
Rhaetian
376
Y. Goddéris et al.
Eocene-Oligocene transition (34 Ma) a distinct, cold climate
pulse was experienced. The d
18 O data obtained from benthic
foraminifera show a deep-water cooling of about 4 °C
(Fig. 27.3). A permanent Antarctic cap began to emerge
(Zachos et al. 2008).
The second step towards global cooling occurred at the
Oligocene-Miocene boundary (23 Ma). But this cold episode is followed by the Miocene climate optimum between
23 and 15 Ma. The latter is particularly problematic because,
according to the d
11 B and d
13 C data from alkenones,
atmospheric CO 2 pressure should have been low, at around
the present value, or even lower, between 200 and 300 ppmv
(Pagani et al. 1999). The reasons for this climate optimum
are still unknown.
From 15 Ma onwards, the climate cooled rapidly and the
East Antarctic sheet developed. The last stage of cooling,
5 Ma ago, was marked by the establishment of the West
Antarctic ice sheet (Fig. 27.3).
The reasons for this cooling are still in dispute. There are
two opposing theories. According to one, the climate evolution of the Cenozoic was largely driven by the opening of
key ocean passages and the closure of others. According to
the other, it was the drop in CO 2 level that was responsible
for this cooling. From 50 Ma onwards, ocean basins began
to become established in the Drake Passage area, allowing
shallow water exchanges between the Atlantic and Pacific
Oceans. Isotopic analyses of neodymium in deep sediments
indicate that around 41 Ma, the flow of exchanges between
ocean basins intensified around Antarctica (Scher and Martin
2006). The intensification of the rate of expansion of the
seabed in the Drake and the Tasmanian Passages 34 Ma ago,
allowed the Antarctic circumpolar current to become established, definitively isolating the South Pole continent. This
date coincides with a major development phase of the
Antarctic ice cap.
The role of ocean passages in global climate change has
been called into question by modeling studies, which tend to
show that glaciation and the appearance of an ice cap over
Antarctica are mainly associated with a decrease in the level
of CO 2 Lefebvre et al. (2012), see also Chap. 3. It should be
noted, however, that this premise is very poorly documented.
Indeed, this is a period for which d
11 B data are non-existent.
At best, we know that CO 2 levels were around 1000 ppmv
40 Ma ago, and about 300 ppmv 24 Ma ago. These data
suggest decreasing levels of CO 2 although it is not possible
to document the evolution precisely. Nevertheless, DeConto
and Pollard (2003) have shown in a simulation that even
Fig. 27.12 Continental runoff
calculated for the Carnian and
Rhaetian, two stages of the
Triassic, at 3122 ppmv of CO 2 .
The red rectangle shows the
position of Europe and indicates
increased humidification of the
area between the Carnian and the
Rhaetian
376
Y. Goddéris et al.