

climate. If causes external to the CO 2 cycle disturb the climate (cosmic rays and cloud nucleation, the passage of the
Earth into a cloud of galactic dust, methane degassing), the
resulting change in f 1 and f 2 factors would cause an imbalance in the carbon cycle, which would find a new balance
over a few million years, by adjusting the pressure of
atmospheric CO 2 to re-establish climate conditions verifying
the paleothermostat.
The Paleozoic Climate: The Chronology
of Major Trends and Their Causes
In general, the Paleozoic climate is described as warmer than
the current one, except for two glacial events with very
different characteristics.
The reasons for this warm climate state are not clearly
understood, but several hypotheses have been put forward.
On the one hand, the degassing of the solid Earth seems to
have been generally greater by about 60% than it is at present. This assertion is based on the fact that the sea level was
generally higher in the geological past than it is today,
except for the Permo-Carboniferous transition. This high sea
level can be explained firstly by the larger volume occupied
by the ocean ridges and therefore a supposedly greater
degassing of the solid Earth. This result has never been
confirmed by other methods apart from sea level and remains
questionable. On the other hand, the absence of abundant
vascular vegetation until the end of the Devonian prevented
the development of modern soils on land surfaces. This
absence of soil reduced the contact time between the inland
water and minerals, thus limiting their weathering. Similarly,
the absence of a root system reduced the acidity of soil
solutions and thus the consumption of atmospheric CO 2 by
continental silicate weathering, which in turn promotes high
CO 2 levels. Berner (2004) estimates that the average global
temperature was ±6 °C higher than it is currently, based on
a numerical modeling study. These very high values are
confirmed by measurements using the paleothermometer
made up of the number of rare molecules Ca
18 O
13 C
16 O 2 in
the carbonates of the Lower Silurian (Came et al. 2007).
Whatever the causes, this warm climate state was interrupted by several glacial events of very different durations
and amplitudes. The Atlas Fig. chapter 3.9 shows the
paleogeographic maps of the Earth during the main periods
of the Phanerozoic.
The Ordovician Glaciation
The d
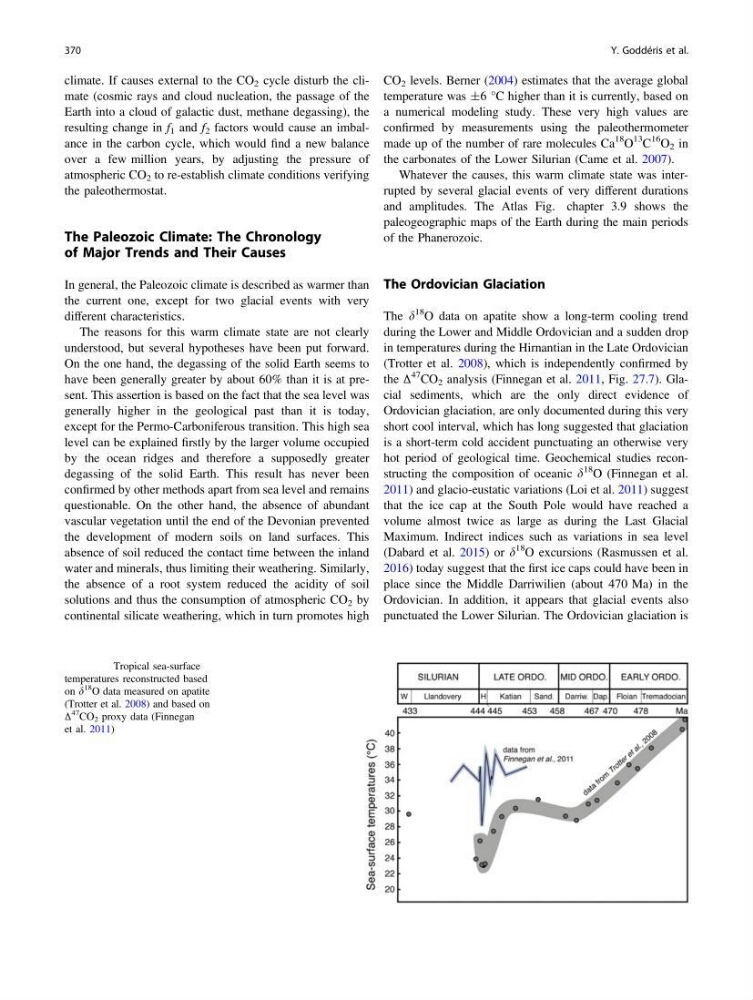
18 O data on apatite show a long-term cooling trend
during the Lower and Middle Ordovician and a sudden drop
in temperatures during the Hirnantian in the Late Ordovician
(Trotter et al. 2008), which is independently confirmed by
the Δ
47 CO 2 analysis (Finnegan et al. 2011, Fig. 27.7). Glacial sediments, which are the only direct evidence of
Ordovician glaciation, are only documented during this very
short cool interval, which has long suggested that glaciation
is a short-term cold accident punctuating an otherwise very
hot period of geological time. Geochemical studies reconstructing the composition of oceanic d
18 O (Finnegan et al.
2011) and glacio-eustatic variations (Loi et al. 2011) suggest
that the ice cap at the South Pole would have reached a
volume almost twice as large as during the Last Glacial
Maximum. Indirect indices such as variations in sea level
(Dabard et al. 2015) or d
18 O excursions (Rasmussen et al.
2016) today suggest that the first ice caps could have been in
place since the Middle Darriwilien (about 470 Ma) in the
Ordovician. In addition, it appears that glacial events also
punctuated the Lower Silurian. The Ordovician glaciation is
Fig. 27.7 Tropical sea-surface
temperatures reconstructed based
on d
18
O data measured on apatite
(Trotter et al. 2008) and based on
Δ
47
CO 2 proxy data (Finnegan
et al. 2011)
370
Y. Goddéris et al.
Earth into a cloud of galactic dust, methane degassing), the
resulting change in f 1 and f 2 factors would cause an imbalance in the carbon cycle, which would find a new balance
over a few million years, by adjusting the pressure of
atmospheric CO 2 to re-establish climate conditions verifying
the paleothermostat.
The Paleozoic Climate: The Chronology
of Major Trends and Their Causes
In general, the Paleozoic climate is described as warmer than
the current one, except for two glacial events with very
different characteristics.
The reasons for this warm climate state are not clearly
understood, but several hypotheses have been put forward.
On the one hand, the degassing of the solid Earth seems to
have been generally greater by about 60% than it is at present. This assertion is based on the fact that the sea level was
generally higher in the geological past than it is today,
except for the Permo-Carboniferous transition. This high sea
level can be explained firstly by the larger volume occupied
by the ocean ridges and therefore a supposedly greater
degassing of the solid Earth. This result has never been
confirmed by other methods apart from sea level and remains
questionable. On the other hand, the absence of abundant
vascular vegetation until the end of the Devonian prevented
the development of modern soils on land surfaces. This
absence of soil reduced the contact time between the inland
water and minerals, thus limiting their weathering. Similarly,
the absence of a root system reduced the acidity of soil
solutions and thus the consumption of atmospheric CO 2 by
continental silicate weathering, which in turn promotes high
CO 2 levels. Berner (2004) estimates that the average global
temperature was ±6 °C higher than it is currently, based on
a numerical modeling study. These very high values are
confirmed by measurements using the paleothermometer
made up of the number of rare molecules Ca
18 O
13 C
16 O 2 in
the carbonates of the Lower Silurian (Came et al. 2007).
Whatever the causes, this warm climate state was interrupted by several glacial events of very different durations
and amplitudes. The Atlas Fig. chapter 3.9 shows the
paleogeographic maps of the Earth during the main periods
of the Phanerozoic.
The Ordovician Glaciation
The d
18 O data on apatite show a long-term cooling trend
during the Lower and Middle Ordovician and a sudden drop
in temperatures during the Hirnantian in the Late Ordovician
(Trotter et al. 2008), which is independently confirmed by
the Δ
47 CO 2 analysis (Finnegan et al. 2011, Fig. 27.7). Glacial sediments, which are the only direct evidence of
Ordovician glaciation, are only documented during this very
short cool interval, which has long suggested that glaciation
is a short-term cold accident punctuating an otherwise very
hot period of geological time. Geochemical studies reconstructing the composition of oceanic d
18 O (Finnegan et al.
2011) and glacio-eustatic variations (Loi et al. 2011) suggest
that the ice cap at the South Pole would have reached a
volume almost twice as large as during the Last Glacial
Maximum. Indirect indices such as variations in sea level
(Dabard et al. 2015) or d
18 O excursions (Rasmussen et al.
2016) today suggest that the first ice caps could have been in
place since the Middle Darriwilien (about 470 Ma) in the
Ordovician. In addition, it appears that glacial events also
punctuated the Lower Silurian. The Ordovician glaciation is
Fig. 27.7 Tropical sea-surface
temperatures reconstructed based
on d
18
O data measured on apatite
(Trotter et al. 2008) and based on
Δ
47
CO 2 proxy data (Finnegan
et al. 2011)
370
Y. Goddéris et al.