

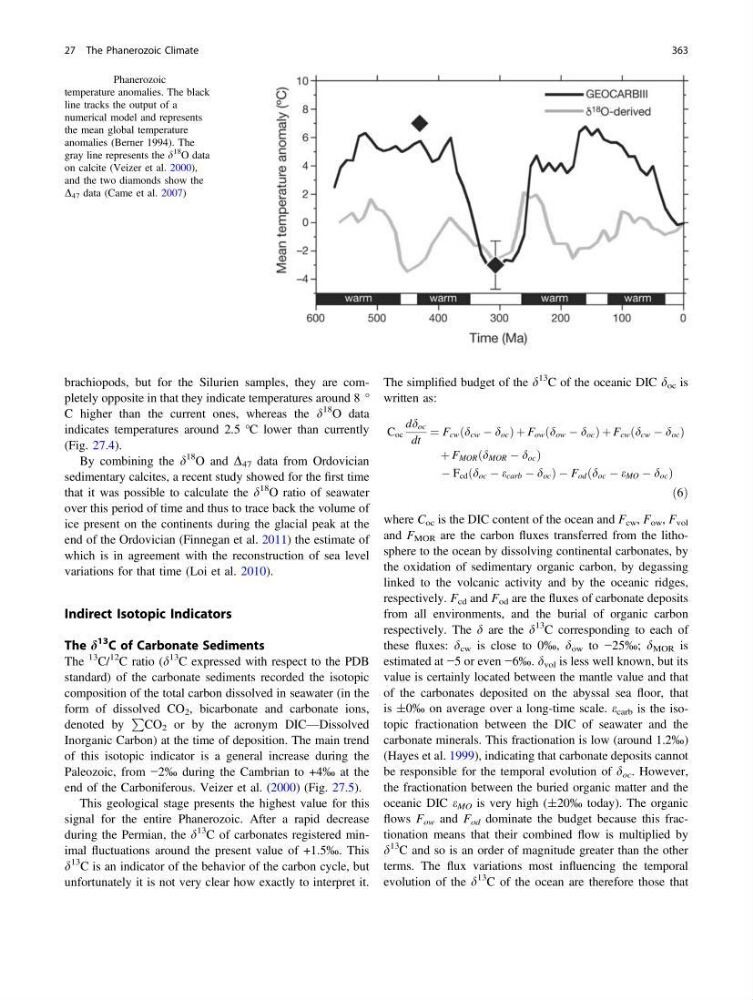
brachiopods, but for the Silurien samples, they are completely opposite in that they indicate temperatures around 8 °
C higher than the current ones, whereas the d
18 O data
indicates temperatures around 2.5 °C lower than currently
(Fig. 27.4).
By combining the d
18 O and D 47 data from Ordovician
sedimentary calcites, a recent study showed for the first time
that it was possible to calculate the d
18 O ratio of seawater
over this period of time and thus to trace back the volume of
ice present on the continents during the glacial peak at the
end of the Ordovician (Finnegan et al. 2011) the estimate of
which is in agreement with the reconstruction of sea level
variations for that time (Loi et al. 2010).
Indirect Isotopic Indicators
The d
13 C of Carbonate Sediments
The
13 C/
12 C ratio (d
13
C expressed with respect to the PDB
standard) of the carbonate sediments recorded the isotopic
composition of the total carbon dissolved in seawater (in the
form of dissolved CO 2 , bicarbonate and carbonate ions,
denoted by
P
CO 2 or by the acronym DIC—Dissolved
Inorganic Carbon) at the time of deposition. The main trend
of this isotopic indicator is a general increase during the
Paleozoic, from −2‰ during the Cambrian to +4‰ at the
end of the Carboniferous. Veizer et al. (2000) (Fig. 27.5).
This geological stage presents the highest value for this
signal for the entire Phanerozoic. After a rapid decrease
during the Permian, the d
13 C of carbonates registered minimal fluctuations around the present value of +1.5‰. This
d
13 C is an indicator of the behavior of the carbon cycle, but
unfortunately it is not very clear how exactly to interpret it.
The simplified budget of the d
13 C of the oceanic DIC d oc is
written as:
C oc
dd oc
dt
¼ F cw d cw À d oc
ð
ÞþF ow d ow À d oc
ð
ÞþF cw d cw À d oc
ð
Þ
þ F MOR d MOR À d oc
ð
Þ
À F cd ðd oc À e carb À d oc Þ À F od d oc À e MO À d oc
ð
Þ
ð6Þ
where C oc is the DIC content of the ocean and F cw , F ow , F vol
and F MOR are the carbon fluxes transferred from the lithosphere to the ocean by dissolving continental carbonates, by
the oxidation of sedimentary organic carbon, by degassing
linked to the volcanic activity and by the oceanic ridges,
respectively. F cd and F od are the fluxes of carbonate deposits
from all environments, and the burial of organic carbon
respectively. The d are the d
13 C corresponding to each of
these fluxes: d cw is close to 0‰, d ow to −25‰; d MOR is
estimated at −5 or even −6‰. d vol is less well known, but its
value is certainly located between the mantle value and that
of the carbonates deposited on the abyssal sea floor, that
is ±0‰ on average over a long-time scale. e carb is the isotopic fractionation between the DIC of seawater and the
carbonate minerals. This fractionation is low (around 1.2‰)
(Hayes et al. 1999), indicating that carbonate deposits cannot
be responsible for the temporal evolution of d oc . However,
the fractionation between the buried organic matter and the
oceanic DIC e MO is very high (±20‰ today). The organic
flows F ow and F od dominate the budget because this fractionation means that their combined flow is multiplied by
d
13 C and so is an order of magnitude greater than the other
terms. The flux variations most influencing the temporal
evolution of the d
13 C of the ocean are therefore those that
Fig. 27.4 Phanerozoic
temperature anomalies. The black
line tracks the output of a
numerical model and represents
the mean global temperature
anomalies (Berner 1994). The
gray line represents the d
18
O data
on calcite (Veizer et al. 2000),
and the two diamonds show the
D 47 data (Came et al. 2007)
27 The Phanerozoic Climate
363
C higher than the current ones, whereas the d
18 O data
indicates temperatures around 2.5 °C lower than currently
(Fig. 27.4).
By combining the d
18 O and D 47 data from Ordovician
sedimentary calcites, a recent study showed for the first time
that it was possible to calculate the d
18 O ratio of seawater
over this period of time and thus to trace back the volume of
ice present on the continents during the glacial peak at the
end of the Ordovician (Finnegan et al. 2011) the estimate of
which is in agreement with the reconstruction of sea level
variations for that time (Loi et al. 2010).
Indirect Isotopic Indicators
The d
13 C of Carbonate Sediments
The
13 C/
12 C ratio (d
13
C expressed with respect to the PDB
standard) of the carbonate sediments recorded the isotopic
composition of the total carbon dissolved in seawater (in the
form of dissolved CO 2 , bicarbonate and carbonate ions,
denoted by
P
CO 2 or by the acronym DIC—Dissolved
Inorganic Carbon) at the time of deposition. The main trend
of this isotopic indicator is a general increase during the
Paleozoic, from −2‰ during the Cambrian to +4‰ at the
end of the Carboniferous. Veizer et al. (2000) (Fig. 27.5).
This geological stage presents the highest value for this
signal for the entire Phanerozoic. After a rapid decrease
during the Permian, the d
13 C of carbonates registered minimal fluctuations around the present value of +1.5‰. This
d
13 C is an indicator of the behavior of the carbon cycle, but
unfortunately it is not very clear how exactly to interpret it.
The simplified budget of the d
13 C of the oceanic DIC d oc is
written as:
C oc
dd oc
dt
¼ F cw d cw À d oc
ð
ÞþF ow d ow À d oc
ð
ÞþF cw d cw À d oc
ð
Þ
þ F MOR d MOR À d oc
ð
Þ
À F cd ðd oc À e carb À d oc Þ À F od d oc À e MO À d oc
ð
Þ
ð6Þ
where C oc is the DIC content of the ocean and F cw , F ow , F vol
and F MOR are the carbon fluxes transferred from the lithosphere to the ocean by dissolving continental carbonates, by
the oxidation of sedimentary organic carbon, by degassing
linked to the volcanic activity and by the oceanic ridges,
respectively. F cd and F od are the fluxes of carbonate deposits
from all environments, and the burial of organic carbon
respectively. The d are the d
13 C corresponding to each of
these fluxes: d cw is close to 0‰, d ow to −25‰; d MOR is
estimated at −5 or even −6‰. d vol is less well known, but its
value is certainly located between the mantle value and that
of the carbonates deposited on the abyssal sea floor, that
is ±0‰ on average over a long-time scale. e carb is the isotopic fractionation between the DIC of seawater and the
carbonate minerals. This fractionation is low (around 1.2‰)
(Hayes et al. 1999), indicating that carbonate deposits cannot
be responsible for the temporal evolution of d oc . However,
the fractionation between the buried organic matter and the
oceanic DIC e MO is very high (±20‰ today). The organic
flows F ow and F od dominate the budget because this fractionation means that their combined flow is multiplied by
d
13 C and so is an order of magnitude greater than the other
terms. The flux variations most influencing the temporal
evolution of the d
13 C of the ocean are therefore those that
Fig. 27.4 Phanerozoic
temperature anomalies. The black
line tracks the output of a
numerical model and represents
the mean global temperature
anomalies (Berner 1994). The
gray line represents the d
18
O data
on calcite (Veizer et al. 2000),
and the two diamonds show the
D 47 data (Came et al. 2007)
27 The Phanerozoic Climate
363