

times the pre-industrial level i.e. 2800–56,000 cm
3 of CO 2
per m
3 of air (Kaufman and Xiao 2003).
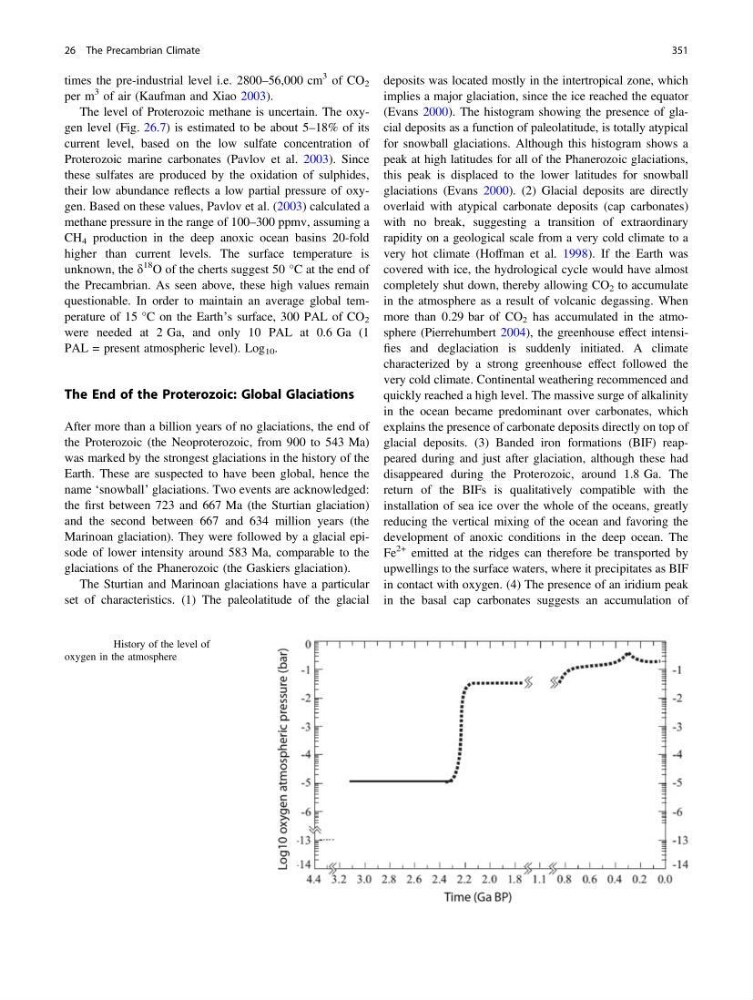
The level of Proterozoic methane is uncertain. The oxygen level (Fig. 26.7) is estimated to be about 5–18% of its
current level, based on the low sulfate concentration of
Proterozoic marine carbonates (Pavlov et al. 2003). Since
these sulfates are produced by the oxidation of sulphides,
their low abundance reflects a low partial pressure of oxygen. Based on these values, Pavlov et al. (2003) calculated a
methane pressure in the range of 100–300 ppmv, assuming a
CH 4 production in the deep anoxic ocean basins 20-fold
higher than current levels. The surface temperature is
unknown, the d
18 O of the cherts suggest 50 °C at the end of
the Precambrian. As seen above, these high values remain
questionable. In order to maintain an average global temperature of 15 °C on the Earth’s surface, 300 PAL of CO 2
were needed at 2 Ga, and only 10 PAL at 0.6 Ga (1
PAL = present atmospheric level). Log 10 .
The End of the Proterozoic: Global Glaciations
After more than a billion years of no glaciations, the end of
the Proterozoic (the Neoproterozoic, from 900 to 543 Ma)
was marked by the strongest glaciations in the history of the
Earth. These are suspected to have been global, hence the
name ‘snowball’ glaciations. Two events are acknowledged:
the first between 723 and 667 Ma (the Sturtian glaciation)
and the second between 667 and 634 million years (the
Marinoan glaciation). They were followed by a glacial episode of lower intensity around 583 Ma, comparable to the
glaciations of the Phanerozoic (the Gaskiers glaciation).
The Sturtian and Marinoan glaciations have a particular
set of characteristics. (1) The paleolatitude of the glacial
deposits was located mostly in the intertropical zone, which
implies a major glaciation, since the ice reached the equator
(Evans 2000). The histogram showing the presence of glacial deposits as a function of paleolatitude, is totally atypical
for snowball glaciations. Although this histogram shows a
peak at high latitudes for all of the Phanerozoic glaciations,
this peak is displaced to the lower latitudes for snowball
glaciations (Evans 2000). (2) Glacial deposits are directly
overlaid with atypical carbonate deposits (cap carbonates)
with no break, suggesting a transition of extraordinary
rapidity on a geological scale from a very cold climate to a
very hot climate (Hoffman et al. 1998). If the Earth was
covered with ice, the hydrological cycle would have almost
completely shut down, thereby allowing CO 2 to accumulate
in the atmosphere as a result of volcanic degassing. When
more than 0.29 bar of CO 2 has accumulated in the atmosphere (Pierrehumbert 2004), the greenhouse effect intensifies and deglaciation is suddenly initiated. A climate
characterized by a strong greenhouse effect followed the
very cold climate. Continental weathering recommenced and
quickly reached a high level. The massive surge of alkalinity
in the ocean became predominant over carbonates, which
explains the presence of carbonate deposits directly on top of
glacial deposits. (3) Banded iron formations (BIF) reappeared during and just after glaciation, although these had
disappeared during the Proterozoic, around 1.8 Ga. The
return of the BIFs is qualitatively compatible with the
installation of sea ice over the whole of the oceans, greatly
reducing the vertical mixing of the ocean and favoring the
development of anoxic conditions in the deep ocean. The
Fe
2+ emitted at the ridges can therefore be transported by
upwellings to the surface waters, where it precipitates as BIF
in contact with oxygen. (4) The presence of an iridium peak
in the basal cap carbonates suggests an accumulation of
Fig. 26.7 History of the level of
oxygen in the atmosphere
26 The Precambrian Climate
351
3 of CO 2
per m
3 of air (Kaufman and Xiao 2003).
The level of Proterozoic methane is uncertain. The oxygen level (Fig. 26.7) is estimated to be about 5–18% of its
current level, based on the low sulfate concentration of
Proterozoic marine carbonates (Pavlov et al. 2003). Since
these sulfates are produced by the oxidation of sulphides,
their low abundance reflects a low partial pressure of oxygen. Based on these values, Pavlov et al. (2003) calculated a
methane pressure in the range of 100–300 ppmv, assuming a
CH 4 production in the deep anoxic ocean basins 20-fold
higher than current levels. The surface temperature is
unknown, the d
18 O of the cherts suggest 50 °C at the end of
the Precambrian. As seen above, these high values remain
questionable. In order to maintain an average global temperature of 15 °C on the Earth’s surface, 300 PAL of CO 2
were needed at 2 Ga, and only 10 PAL at 0.6 Ga (1
PAL = present atmospheric level). Log 10 .
The End of the Proterozoic: Global Glaciations
After more than a billion years of no glaciations, the end of
the Proterozoic (the Neoproterozoic, from 900 to 543 Ma)
was marked by the strongest glaciations in the history of the
Earth. These are suspected to have been global, hence the
name ‘snowball’ glaciations. Two events are acknowledged:
the first between 723 and 667 Ma (the Sturtian glaciation)
and the second between 667 and 634 million years (the
Marinoan glaciation). They were followed by a glacial episode of lower intensity around 583 Ma, comparable to the
glaciations of the Phanerozoic (the Gaskiers glaciation).
The Sturtian and Marinoan glaciations have a particular
set of characteristics. (1) The paleolatitude of the glacial
deposits was located mostly in the intertropical zone, which
implies a major glaciation, since the ice reached the equator
(Evans 2000). The histogram showing the presence of glacial deposits as a function of paleolatitude, is totally atypical
for snowball glaciations. Although this histogram shows a
peak at high latitudes for all of the Phanerozoic glaciations,
this peak is displaced to the lower latitudes for snowball
glaciations (Evans 2000). (2) Glacial deposits are directly
overlaid with atypical carbonate deposits (cap carbonates)
with no break, suggesting a transition of extraordinary
rapidity on a geological scale from a very cold climate to a
very hot climate (Hoffman et al. 1998). If the Earth was
covered with ice, the hydrological cycle would have almost
completely shut down, thereby allowing CO 2 to accumulate
in the atmosphere as a result of volcanic degassing. When
more than 0.29 bar of CO 2 has accumulated in the atmosphere (Pierrehumbert 2004), the greenhouse effect intensifies and deglaciation is suddenly initiated. A climate
characterized by a strong greenhouse effect followed the
very cold climate. Continental weathering recommenced and
quickly reached a high level. The massive surge of alkalinity
in the ocean became predominant over carbonates, which
explains the presence of carbonate deposits directly on top of
glacial deposits. (3) Banded iron formations (BIF) reappeared during and just after glaciation, although these had
disappeared during the Proterozoic, around 1.8 Ga. The
return of the BIFs is qualitatively compatible with the
installation of sea ice over the whole of the oceans, greatly
reducing the vertical mixing of the ocean and favoring the
development of anoxic conditions in the deep ocean. The
Fe
2+ emitted at the ridges can therefore be transported by
upwellings to the surface waters, where it precipitates as BIF
in contact with oxygen. (4) The presence of an iridium peak
in the basal cap carbonates suggests an accumulation of
Fig. 26.7 History of the level of
oxygen in the atmosphere
26 The Precambrian Climate
351