

The fifty-meter thick loess deposits of China and North
America are probably the most spectacular evidence of how
the dust cycle is capable of shaping immense landscapes—
loess deposits cover 10% of the emerged landmasses. Loess
accumulation in China has been an ongoing process for over
20 million years, since the uplift of the Tibetan plateau
caused widespread aridification of central-eastern Asia.
Beyond that, little is known, although isolated information
on deep paleoclimate conditions at least dating back to the
Paleozoic (*500 million years ago) can be derived, based
on the analysis of geologic formations whose origin can be
ultimately linked to eolian sedimentation.
We have a better picture of the global dust cycle on
Quaternary time scales, especially since the late Pleistocene.
From polar ice core records we know that a strong
dust-climate coupling was a persistent feature at least over
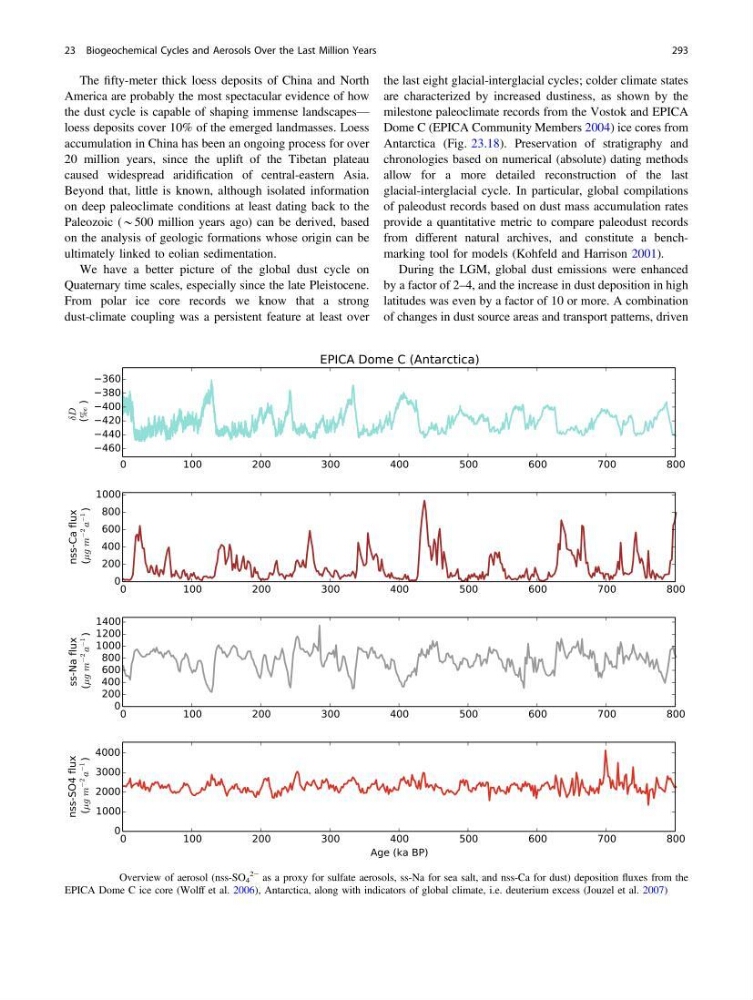
the last eight glacial-interglacial cycles; colder climate states
are characterized by increased dustiness, as shown by the
milestone paleoclimate records from the Vostok and EPICA
Dome C (EPICA Community Members 2004) ice cores from
Antarctica (Fig. 23.18). Preservation of stratigraphy and
chronologies based on numerical (absolute) dating methods
allow for a more detailed reconstruction of the last
glacial-interglacial cycle. In particular, global compilations
of paleodust records based on dust mass accumulation rates
provide a quantitative metric to compare paleodust records
from different natural archives, and constitute a benchmarking tool for models (Kohfeld and Harrison 2001).
During the LGM, global dust emissions were enhanced
by a factor of 2–4, and the increase in dust deposition in high
latitudes was even by a factor of 10 or more. A combination
of changes in dust source areas and transport patterns, driven
Fig. 23.18 Overview of aerosol (nss-SO 4
2− as a proxy for sulfate aerosols, ss-Na for sea salt, and nss-Ca for dust) deposition fluxes from the
EPICA Dome C ice core (Wolff et al. 2006), Antarctica, along with indicators of global climate, i.e. deuterium excess (Jouzel et al. 2007)
23 Biogeochemical Cycles and Aerosols Over the Last Million Years
293
America are probably the most spectacular evidence of how
the dust cycle is capable of shaping immense landscapes—
loess deposits cover 10% of the emerged landmasses. Loess
accumulation in China has been an ongoing process for over
20 million years, since the uplift of the Tibetan plateau
caused widespread aridification of central-eastern Asia.
Beyond that, little is known, although isolated information
on deep paleoclimate conditions at least dating back to the
Paleozoic (*500 million years ago) can be derived, based
on the analysis of geologic formations whose origin can be
ultimately linked to eolian sedimentation.
We have a better picture of the global dust cycle on
Quaternary time scales, especially since the late Pleistocene.
From polar ice core records we know that a strong
dust-climate coupling was a persistent feature at least over
the last eight glacial-interglacial cycles; colder climate states
are characterized by increased dustiness, as shown by the
milestone paleoclimate records from the Vostok and EPICA
Dome C (EPICA Community Members 2004) ice cores from
Antarctica (Fig. 23.18). Preservation of stratigraphy and
chronologies based on numerical (absolute) dating methods
allow for a more detailed reconstruction of the last
glacial-interglacial cycle. In particular, global compilations
of paleodust records based on dust mass accumulation rates
provide a quantitative metric to compare paleodust records
from different natural archives, and constitute a benchmarking tool for models (Kohfeld and Harrison 2001).
During the LGM, global dust emissions were enhanced
by a factor of 2–4, and the increase in dust deposition in high
latitudes was even by a factor of 10 or more. A combination
of changes in dust source areas and transport patterns, driven
Fig. 23.18 Overview of aerosol (nss-SO 4
2− as a proxy for sulfate aerosols, ss-Na for sea salt, and nss-Ca for dust) deposition fluxes from the
EPICA Dome C ice core (Wolff et al. 2006), Antarctica, along with indicators of global climate, i.e. deuterium excess (Jouzel et al. 2007)
23 Biogeochemical Cycles and Aerosols Over the Last Million Years
293