

terrestrial biosphere loses carbon (Obata 2007; Menviel et al.
2008b; Bozbiyik et al. 2011) while in others it is the opposite
with the ocean losing carbon and terrestrial biosphere
gaining carbon (Schmittner and Galbraith 2008; Bouttes
et al. 2012; Matsumoto and Yokoyama 2013). Alternatively,
simulations with artificially increased salinity in the Southern Ocean have been tested, resulting in a strengthening of
the AABW and a loss of ocean carbon, yielding an overall
CO 2 increase of around 20 ppm (Menviel et al. 2015). In
general, simulations with atmosphere-ocean-terrestrial biosphere models in glacial background climate produce a large
range of CO 2 changes due to the different processes, which
are summed up in Fig. 23.10.
In addition, rapid CO 2 changes during the last deglaciation have been recently highlighted, such as the rapid CO 2
rise concomitant to the warming in the Northern Hemisphere
at the Bølling Allerød around 14,600 years ago (Marcott
et al. 2014). On top of changes in the Atlantic meridional
overturning circulation, permafrost thawing, releasing large
quantities of CO 2 trapped in frozen soil, has been suggested
as a potential driver of the CO 2 rise (Köhler et al. 2014).
Changes in atmospheric methane (CH 4 ) concentration
measured in ice cores are linked closely to the rapid surface
temperature variations in Greenland during the last glacial
period. In particular, CH 4 increases of 100–200 ppbv are
associated with the abrupt DO warming events. CH 4 concentration is a global signal that reflects the response of the
terrestrial biosphere, mainly wetlands, to hydroclimate
changes (Brook et al. 2000) and its close link with Greenland temperature is classically interpreted as reflecting
changing CH 4 emissions from tropical and boreal wetlands
in phase with Greenland temperature (Chappellaz et al.
1993). A detailed study of the abrupt Bølling warming, the
penultimate warming in the series of abrupt climate changes
during the last glacial, suggests that changes in Greenland
temperatures and atmospheric CH 4 emissions occurred
essentially synchronously (within 20 yr; Rosen et al. 2014).
CH 4 concentrations measured in Greenland ice cores are
higher than those measured in Antarctic ice cores primarily
because of enhanced CH 4 emissions in the Northern Hemisphere due to its larger land area (Chappellaz et al. 1997).
However, rapid CH 4 changes are seen in both hemispheres
and this feature is commonly used to synchronise Antarctic
and Greenland ice core chronologies (Blunier et al. 1998;
Buizert et al. 2015).
Nitrogen Cycle
Natural Nitrogen Cycle
Nitrogen (N) interacts with climate in two ways. First, like
carbon dioxide and methane, nitrous oxide N 2 O is a greenhouse gas. It is in fact more powerful than CO 2 or CH 4 , but
its atmospheric concentration is less, currently 325 ppb
(NOAA, http://esrl.noaa.gov/gmd/). Second, nitrogen is also
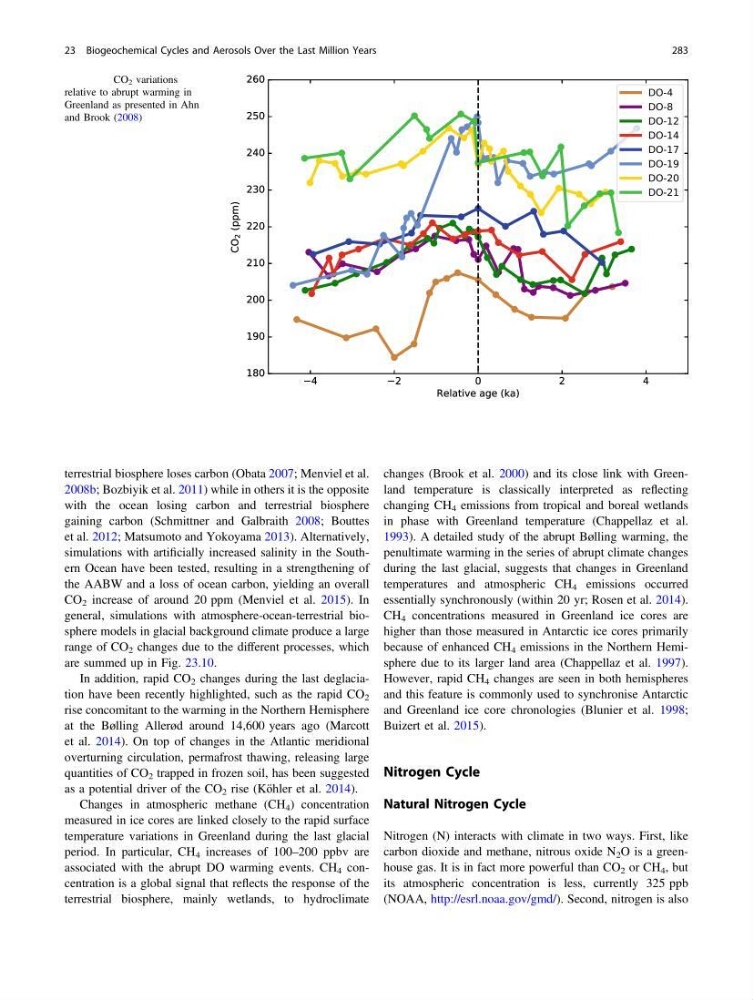
Fig. 23.9 CO 2 variations
relative to abrupt warming in
Greenland as presented in Ahn
and Brook (2008)
23 Biogeochemical Cycles and Aerosols Over the Last Million Years
283
2008b; Bozbiyik et al. 2011) while in others it is the opposite
with the ocean losing carbon and terrestrial biosphere
gaining carbon (Schmittner and Galbraith 2008; Bouttes
et al. 2012; Matsumoto and Yokoyama 2013). Alternatively,
simulations with artificially increased salinity in the Southern Ocean have been tested, resulting in a strengthening of
the AABW and a loss of ocean carbon, yielding an overall
CO 2 increase of around 20 ppm (Menviel et al. 2015). In
general, simulations with atmosphere-ocean-terrestrial biosphere models in glacial background climate produce a large
range of CO 2 changes due to the different processes, which
are summed up in Fig. 23.10.
In addition, rapid CO 2 changes during the last deglaciation have been recently highlighted, such as the rapid CO 2
rise concomitant to the warming in the Northern Hemisphere
at the Bølling Allerød around 14,600 years ago (Marcott
et al. 2014). On top of changes in the Atlantic meridional
overturning circulation, permafrost thawing, releasing large
quantities of CO 2 trapped in frozen soil, has been suggested
as a potential driver of the CO 2 rise (Köhler et al. 2014).
Changes in atmospheric methane (CH 4 ) concentration
measured in ice cores are linked closely to the rapid surface
temperature variations in Greenland during the last glacial
period. In particular, CH 4 increases of 100–200 ppbv are
associated with the abrupt DO warming events. CH 4 concentration is a global signal that reflects the response of the
terrestrial biosphere, mainly wetlands, to hydroclimate
changes (Brook et al. 2000) and its close link with Greenland temperature is classically interpreted as reflecting
changing CH 4 emissions from tropical and boreal wetlands
in phase with Greenland temperature (Chappellaz et al.
1993). A detailed study of the abrupt Bølling warming, the
penultimate warming in the series of abrupt climate changes
during the last glacial, suggests that changes in Greenland
temperatures and atmospheric CH 4 emissions occurred
essentially synchronously (within 20 yr; Rosen et al. 2014).
CH 4 concentrations measured in Greenland ice cores are
higher than those measured in Antarctic ice cores primarily
because of enhanced CH 4 emissions in the Northern Hemisphere due to its larger land area (Chappellaz et al. 1997).
However, rapid CH 4 changes are seen in both hemispheres
and this feature is commonly used to synchronise Antarctic
and Greenland ice core chronologies (Blunier et al. 1998;
Buizert et al. 2015).
Nitrogen Cycle
Natural Nitrogen Cycle
Nitrogen (N) interacts with climate in two ways. First, like
carbon dioxide and methane, nitrous oxide N 2 O is a greenhouse gas. It is in fact more powerful than CO 2 or CH 4 , but
its atmospheric concentration is less, currently 325 ppb
(NOAA, http://esrl.noaa.gov/gmd/). Second, nitrogen is also
Fig. 23.9 CO 2 variations
relative to abrupt warming in
Greenland as presented in Ahn
and Brook (2008)
23 Biogeochemical Cycles and Aerosols Over the Last Million Years
283