

Greenland ice is prone to in situ production of CO 2 , which
alters the atmospheric CO 2 concentration already within the
ice (Tschumi and Stauffer 2000). Measurements of past CH 4
concentrations extracted from both Greenland and Antarctic
ice cores are reliable. While the first CH 4 records covered the
last 160,000 years (Chappellaz et al. 1990), they also now
date back to 800,000 years (Loulergue et al. 2008). In
addition to greenhouse gas concentrations, measurements of
the air from ice cores now also involve d
13 C from CO 2 ,
termed d
13 CO 2 (Schneider et al. 2013; Schmitt et al. 2012;
Lourantou et al. 2010). Ice cores offer a unique possibility to
quantify the sequence of events occurring between greenhouse gas variations and changes in ice core tracers inform
on other parts of the climate system such as local surface
temperature using ice d
18 O (see Volume 1, Chap. 11).
Sediment Cores
At the bottom of oceans and lakes, sediments progressively
accumulate as various particles and debris are deposited.
They include both organic material, such as shells, and
inorganic material, such as clay. The invention of the first
piston corer in 1947 by Kullenberg allowed marine sediment
cores to be extracted from the ocean bottom, yielding a
wealth of information on past ocean changes (Volume 1,
Chap. 21). In particular, sediments provide information on
past marine productivity, for example by measuring the
fraction of organic material, calcite or opal (biogenic silica).
The proportion of organic material measured in upwelling
zones is large, because productivity is high. In regions where
organic material is not well preserved, silicate can be used as
another proxy for biological productivity. Other proxies are
also used, such as
10 Be, authigenic U,
231 Pa/
230 Th). They
rely on the fact that some elements preferentially fix to
particles (Th) while others remain in solution (U, Pa). Their
ratio gives an indication of past particle flux in the water
column, hence biological productivity.
As detailed in Volume 1, Chap. 21, carbon isotopes are
measured in foraminifera shells providing constraints on the
carbon cycle. Whenever carbon is exchanged at an interface,
fractionation takes place, which modifies d
13 C defined as:
d
13
C ¼
13
C
12 C
sample
13 C
12 C
standard
À 1
0
B
@
1
C
A Â 1000
The standard is the PDB (Peedee belemnite) carbon isotope standard, which corresponds approximately to average
limestone (Craig 1957).
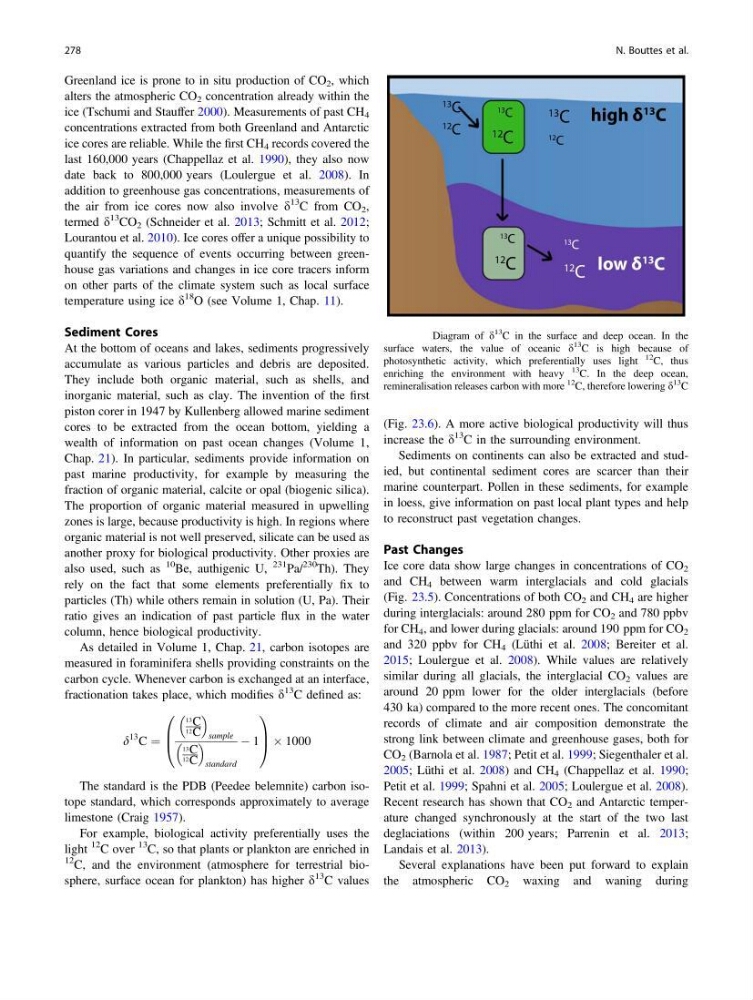
For example, biological activity preferentially uses the
light
12 C over
13 C, so that plants or plankton are enriched in
12 C, and the environment (atmosphere for terrestrial biosphere, surface ocean for plankton) has higher d
13 C values
(Fig. 23.6). A more active biological productivity will thus
increase the d
13 C in the surrounding environment.
Sediments on continents can also be extracted and studied, but continental sediment cores are scarcer than their
marine counterpart. Pollen in these sediments, for example
in loess, give information on past local plant types and help
to reconstruct past vegetation changes.
Past Changes
Ice core data show large changes in concentrations of CO 2
and CH 4 between warm interglacials and cold glacials
(Fig. 23.5). Concentrations of both CO 2 and CH 4 are higher
during interglacials: around 280 ppm for CO 2 and 780 ppbv
for CH 4 , and lower during glacials: around 190 ppm for CO 2
and 320 ppbv for CH 4 (Lüthi et al. 2008; Bereiter et al.
2015; Loulergue et al. 2008). While values are relatively
similar during all glacials, the interglacial CO 2 values are
around 20 ppm lower for the older interglacials (before
430 ka) compared to the more recent ones. The concomitant
records of climate and air composition demonstrate the
strong link between climate and greenhouse gases, both for
CO 2 (Barnola et al. 1987; Petit et al. 1999; Siegenthaler et al.
2005; Lüthi et al. 2008) and CH 4 (Chappellaz et al. 1990;
Petit et al. 1999; Spahni et al. 2005; Loulergue et al. 2008).
Recent research has shown that CO 2 and Antarctic temperature changed synchronously at the start of the two last
deglaciations (within 200 years; Parrenin et al. 2013;
Landais et al. 2013).
Several explanations have been put forward to explain
the atmospheric CO 2 waxing and waning during
12
C
13
C
12 C
13
C
12
C
13
C
12
C
13 C
12 C
13 C
high δ
13
C
low δ
13
C
Fig. 23.6 Diagram of d
13
C in the surface and deep ocean. In the
surface waters, the value of oceanic d
13
C is high because of
photosynthetic activity, which preferentially uses light
12 C, thus
enriching the environment with heavy
13
C. In the deep ocean,
remineralisation releases carbon with more
12
C, therefore lowering d
13
C
278
N. Bouttes et al.
alters the atmospheric CO 2 concentration already within the
ice (Tschumi and Stauffer 2000). Measurements of past CH 4
concentrations extracted from both Greenland and Antarctic
ice cores are reliable. While the first CH 4 records covered the
last 160,000 years (Chappellaz et al. 1990), they also now
date back to 800,000 years (Loulergue et al. 2008). In
addition to greenhouse gas concentrations, measurements of
the air from ice cores now also involve d
13 C from CO 2 ,
termed d
13 CO 2 (Schneider et al. 2013; Schmitt et al. 2012;
Lourantou et al. 2010). Ice cores offer a unique possibility to
quantify the sequence of events occurring between greenhouse gas variations and changes in ice core tracers inform
on other parts of the climate system such as local surface
temperature using ice d
18 O (see Volume 1, Chap. 11).
Sediment Cores
At the bottom of oceans and lakes, sediments progressively
accumulate as various particles and debris are deposited.
They include both organic material, such as shells, and
inorganic material, such as clay. The invention of the first
piston corer in 1947 by Kullenberg allowed marine sediment
cores to be extracted from the ocean bottom, yielding a
wealth of information on past ocean changes (Volume 1,
Chap. 21). In particular, sediments provide information on
past marine productivity, for example by measuring the
fraction of organic material, calcite or opal (biogenic silica).
The proportion of organic material measured in upwelling
zones is large, because productivity is high. In regions where
organic material is not well preserved, silicate can be used as
another proxy for biological productivity. Other proxies are
also used, such as
10 Be, authigenic U,
231 Pa/
230 Th). They
rely on the fact that some elements preferentially fix to
particles (Th) while others remain in solution (U, Pa). Their
ratio gives an indication of past particle flux in the water
column, hence biological productivity.
As detailed in Volume 1, Chap. 21, carbon isotopes are
measured in foraminifera shells providing constraints on the
carbon cycle. Whenever carbon is exchanged at an interface,
fractionation takes place, which modifies d
13 C defined as:
d
13
C ¼
13
C
12 C
sample
13 C
12 C
standard
À 1
0
B
@
1
C
A Â 1000
The standard is the PDB (Peedee belemnite) carbon isotope standard, which corresponds approximately to average
limestone (Craig 1957).
For example, biological activity preferentially uses the
light
12 C over
13 C, so that plants or plankton are enriched in
12 C, and the environment (atmosphere for terrestrial biosphere, surface ocean for plankton) has higher d
13 C values
(Fig. 23.6). A more active biological productivity will thus
increase the d
13 C in the surrounding environment.
Sediments on continents can also be extracted and studied, but continental sediment cores are scarcer than their
marine counterpart. Pollen in these sediments, for example
in loess, give information on past local plant types and help
to reconstruct past vegetation changes.
Past Changes
Ice core data show large changes in concentrations of CO 2
and CH 4 between warm interglacials and cold glacials
(Fig. 23.5). Concentrations of both CO 2 and CH 4 are higher
during interglacials: around 280 ppm for CO 2 and 780 ppbv
for CH 4 , and lower during glacials: around 190 ppm for CO 2
and 320 ppbv for CH 4 (Lüthi et al. 2008; Bereiter et al.
2015; Loulergue et al. 2008). While values are relatively
similar during all glacials, the interglacial CO 2 values are
around 20 ppm lower for the older interglacials (before
430 ka) compared to the more recent ones. The concomitant
records of climate and air composition demonstrate the
strong link between climate and greenhouse gases, both for
CO 2 (Barnola et al. 1987; Petit et al. 1999; Siegenthaler et al.
2005; Lüthi et al. 2008) and CH 4 (Chappellaz et al. 1990;
Petit et al. 1999; Spahni et al. 2005; Loulergue et al. 2008).
Recent research has shown that CO 2 and Antarctic temperature changed synchronously at the start of the two last
deglaciations (within 200 years; Parrenin et al. 2013;
Landais et al. 2013).
Several explanations have been put forward to explain
the atmospheric CO 2 waxing and waning during
12
C
13
C
12 C
13
C
12
C
13
C
12
C
13 C
12 C
13 C
high δ
13
C
low δ
13
C
Fig. 23.6 Diagram of d
13
C in the surface and deep ocean. In the
surface waters, the value of oceanic d
13
C is high because of
photosynthetic activity, which preferentially uses light
12 C, thus
enriching the environment with heavy
13
C. In the deep ocean,
remineralisation releases carbon with more
12
C, therefore lowering d
13
C
278
N. Bouttes et al.