

However, like all paleoclimate indicators, the U
k
0
37 index
also presents various biases that limit its use in specific
oceanographic contexts. A few of the most significant ones
are as follows:
– The temporal evolution of the alkenone-producing species. E. huxleyi, which is currently the main producer of
alkenones, was not present prior to MIS 8 (Thierstein
et al. 1977). Alkenones are also produced by other species such as Gephyrocapsa oceanica, but with different
temperature—U
k
0
37 index relationships. Care must therefore be taken when applying the U
k
0
37 method to ancient
sediments.
– The tiny coccolithophorids are easily transported by sea
currents, so these algae can travel long distances between
their place of production and place of sedimentation.
A significant portion of the residual input to sediments
may thus originate from remote areas with very different
hydrological conditions. This problem is particularly
significant in areas of low productivity or in frontal zones
that separate two distinctly different water masses (Sicre
et al. 2005).
– Reconstructions could be biased toward a specific season
(Rosell-Melé and Prahl 2013) and a degree of nonlinearity may exist in the relation between alkenones and
SST at the higher and lower ends of the temperature
range (Conte et al. 2006).
Another organic tracer to reconstruct past SST is based on
the quantification of the average number of cyclopentane
rings found in glycerol dialkyl glycerol tetraethers (GDGTs)
of archaea membrane lipids. An index, called TEX 86 , was
deduced after analyzing the GDGTs distribution in marine
surface sediments in comparison to annual mean SSTs
(Schouten et al. 2002).
Recently, a number of different TEX 86 calibrations have
been developed (Kim et al. 2010; Tierney and Tingley 2014;
Ho and Laepple 2016), in response to possible differences in
membrane adaptation of the resident archaea communities at
different temperatures, and to the differences found between
the TEX 86 ratio and other SST reconstruction proxies.
A number of pre- and post-depositional processes can
influence the TEX 86 ratio. For some processes, this influence
can be constrained. For example, the BIT index is used to
track the amount of terrestrial GDGT input, using a ratio of
branched versus isoprenoid GDGTs (Weijers et al. 2006;
Schouten et al. 2013). Nonetheless, the scientific understanding of TEX 86 remains imperfect, particularly since the
effects of environmental factors such as salinity, nutrient
concentrations, and water column structure may modulate
the TEX 86 –SST relationship (Tierney and Tingley 2014).
Chemical Tracers
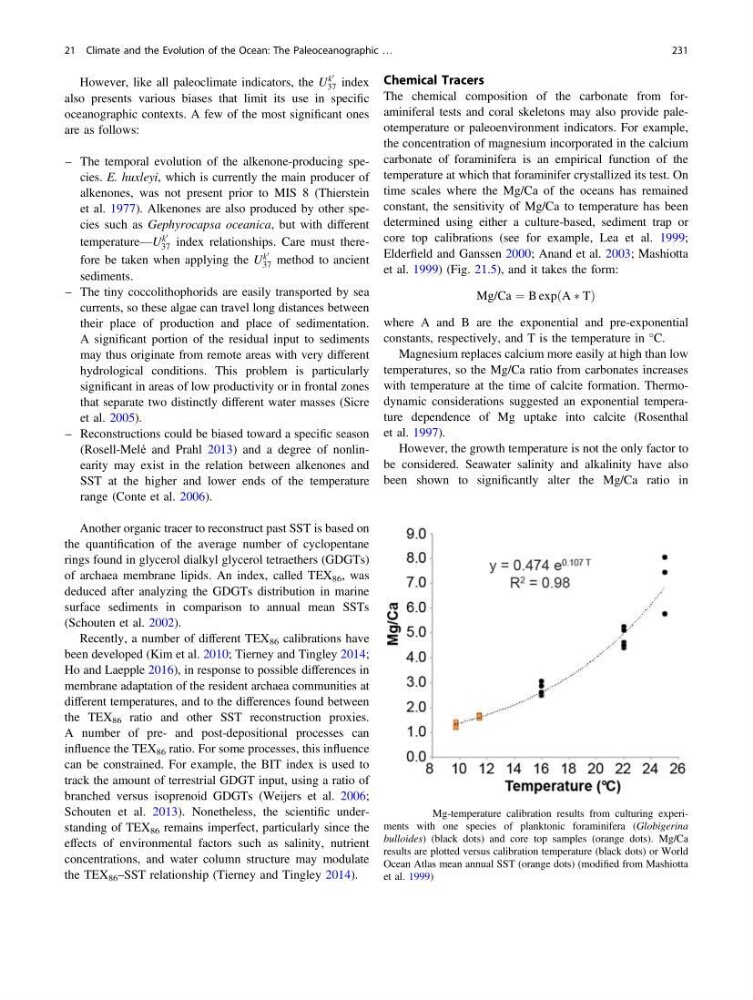
The chemical composition of the carbonate from foraminiferal tests and coral skeletons may also provide paleotemperature or paleoenvironment indicators. For example,
the concentration of magnesium incorporated in the calcium
carbonate of foraminifera is an empirical function of the
temperature at which that foraminifer crystallized its test. On
time scales where the Mg/Ca of the oceans has remained
constant, the sensitivity of Mg/Ca to temperature has been
determined using either a culture-based, sediment trap or
core top calibrations (see for example, Lea et al. 1999;
Elderfield and Ganssen 2000; Anand et al. 2003; Mashiotta
et al. 1999) (Fig. 21.5), and it takes the form:
Mg/Ca ¼ B exp A Ã T
ð
Þ
where A and B are the exponential and pre-exponential
constants, respectively, and T is the temperature in °C.
Magnesium replaces calcium more easily at high than low
temperatures, so the Mg/Ca ratio from carbonates increases
with temperature at the time of calcite formation. Thermodynamic considerations suggested an exponential temperature dependence of Mg uptake into calcite (Rosenthal
et al. 1997).
However, the growth temperature is not the only factor to
be considered. Seawater salinity and alkalinity have also
been shown to significantly alter the Mg/Ca ratio in
Fig. 21.5 Mg-temperature calibration results from culturing experiments with one species of planktonic foraminifera (Globigerina
bulloides) (black dots) and core top samples (orange dots). Mg/Ca
results are plotted versus calibration temperature (black dots) or World
Ocean Atlas mean annual SST (orange dots) (modified from Mashiotta
et al. 1999)
21 Climate and the Evolution of the Ocean: The Paleoceanographic …
231
k
0
37 index
also presents various biases that limit its use in specific
oceanographic contexts. A few of the most significant ones
are as follows:
– The temporal evolution of the alkenone-producing species. E. huxleyi, which is currently the main producer of
alkenones, was not present prior to MIS 8 (Thierstein
et al. 1977). Alkenones are also produced by other species such as Gephyrocapsa oceanica, but with different
temperature—U
k
0
37 index relationships. Care must therefore be taken when applying the U
k
0
37 method to ancient
sediments.
– The tiny coccolithophorids are easily transported by sea
currents, so these algae can travel long distances between
their place of production and place of sedimentation.
A significant portion of the residual input to sediments
may thus originate from remote areas with very different
hydrological conditions. This problem is particularly
significant in areas of low productivity or in frontal zones
that separate two distinctly different water masses (Sicre
et al. 2005).
– Reconstructions could be biased toward a specific season
(Rosell-Melé and Prahl 2013) and a degree of nonlinearity may exist in the relation between alkenones and
SST at the higher and lower ends of the temperature
range (Conte et al. 2006).
Another organic tracer to reconstruct past SST is based on
the quantification of the average number of cyclopentane
rings found in glycerol dialkyl glycerol tetraethers (GDGTs)
of archaea membrane lipids. An index, called TEX 86 , was
deduced after analyzing the GDGTs distribution in marine
surface sediments in comparison to annual mean SSTs
(Schouten et al. 2002).
Recently, a number of different TEX 86 calibrations have
been developed (Kim et al. 2010; Tierney and Tingley 2014;
Ho and Laepple 2016), in response to possible differences in
membrane adaptation of the resident archaea communities at
different temperatures, and to the differences found between
the TEX 86 ratio and other SST reconstruction proxies.
A number of pre- and post-depositional processes can
influence the TEX 86 ratio. For some processes, this influence
can be constrained. For example, the BIT index is used to
track the amount of terrestrial GDGT input, using a ratio of
branched versus isoprenoid GDGTs (Weijers et al. 2006;
Schouten et al. 2013). Nonetheless, the scientific understanding of TEX 86 remains imperfect, particularly since the
effects of environmental factors such as salinity, nutrient
concentrations, and water column structure may modulate
the TEX 86 –SST relationship (Tierney and Tingley 2014).
Chemical Tracers
The chemical composition of the carbonate from foraminiferal tests and coral skeletons may also provide paleotemperature or paleoenvironment indicators. For example,
the concentration of magnesium incorporated in the calcium
carbonate of foraminifera is an empirical function of the
temperature at which that foraminifer crystallized its test. On
time scales where the Mg/Ca of the oceans has remained
constant, the sensitivity of Mg/Ca to temperature has been
determined using either a culture-based, sediment trap or
core top calibrations (see for example, Lea et al. 1999;
Elderfield and Ganssen 2000; Anand et al. 2003; Mashiotta
et al. 1999) (Fig. 21.5), and it takes the form:
Mg/Ca ¼ B exp A Ã T
ð
Þ
where A and B are the exponential and pre-exponential
constants, respectively, and T is the temperature in °C.
Magnesium replaces calcium more easily at high than low
temperatures, so the Mg/Ca ratio from carbonates increases
with temperature at the time of calcite formation. Thermodynamic considerations suggested an exponential temperature dependence of Mg uptake into calcite (Rosenthal
et al. 1997).
However, the growth temperature is not the only factor to
be considered. Seawater salinity and alkalinity have also
been shown to significantly alter the Mg/Ca ratio in
Fig. 21.5 Mg-temperature calibration results from culturing experiments with one species of planktonic foraminifera (Globigerina
bulloides) (black dots) and core top samples (orange dots). Mg/Ca
results are plotted versus calibration temperature (black dots) or World
Ocean Atlas mean annual SST (orange dots) (modified from Mashiotta
et al. 1999)
21 Climate and the Evolution of the Ocean: The Paleoceanographic …
231