

the northern hemisphere, separated by interglacial periods
when the ice caps receded and remained confined to the
Antarctic and Greenland.
We have been in an interglacial period, called the Holocene, for the past 11,000 years. The various aspects of the
evolution of climate will be expanded upon later in this
book.
The last million years is the best understood geological
period, because climate can be reconstructed from detailed
information provided by polar ice and marine and continental sediments. Over this period, a succession of
oscillations between glacial and interglacial periods marks
intervals which are the result of small changes in the
Earth’s orbit around the Sun. The glacial periods last
almost ten times longer than the interglacial periods but
they are interspersed with rapid warmings which follow
the outbreaks of cold in the North Atlantic and neighboring landmasses. All these major climate shifts do not
occur as a result of chance and it is the work of climatologists and paleoclimatologists to understand them by
analyzing climate mechanisms and the causes of their
variability.
-0.8
-0.6
-0.4
-0.2
0
0.2
0.4
0.6
0.8
1850
1870
1890
1910
1930
1950
1970
1990
2010
-0.8
-0.6
-0.4
-0.2
0
0.2
0.4
0.6
0.8
1000
1100
1200
1300
1400
1500
1600
1700
1800
1900
2000
2.5
3
3.5
4
4.5
5
5.5
0
100
200
300
400
500
600
700
800
900
1000
570
225
65
1,8
0
chaud
actuel
froid
4600
3000
2000
1000
Ere
Primaire
Ere
Secondaire
Ere
Tertiaire
Age (Ma)
0
-130
Niveau
de la mer
(m)
Age (ka)
Ecart à la tempé rature moyenne (°C)
Age (AD)
Age (AD)
rature moyenne (°C)
Précambrien
A
B
C
D
Precambrian
Paleozoic
Era
Mesozoic
Era
Cenozoic
Era
hot
cold
present day
Isotopic composition of oxygen (δ
18 O , ‰)
Sea level
Time
Time
Time
Time
540
250
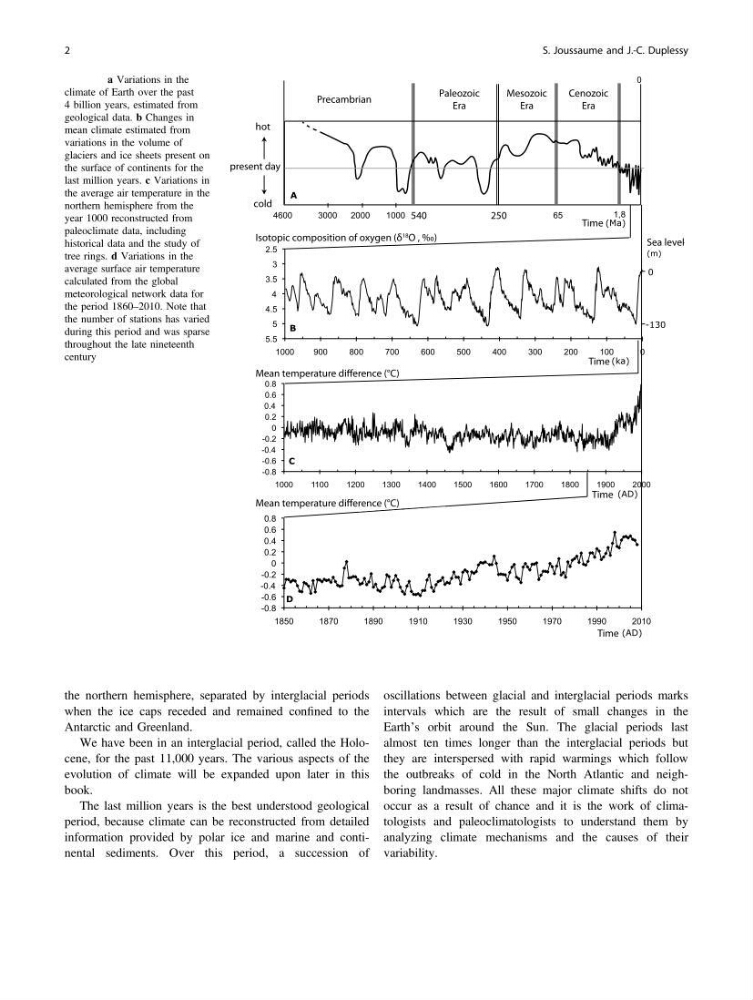
Fig. 1.1 a Variations in the
climate of Earth over the past
4 billion years, estimated from
geological data. b Changes in
mean climate estimated from
variations in the volume of
glaciers and ice sheets present on
the surface of continents for the
last million years. c Variations in
the average air temperature in the
northern hemisphere from the
year 1000 reconstructed from
paleoclimate data, including
historical data and the study of
tree rings. d Variations in the
average surface air temperature
calculated from the global
meteorological network data for
the period 1860–2010. Note that
the number of stations has varied
during this period and was sparse
throughout the late nineteenth
century
2
S. Joussaume and J.-C. Duplessy
when the ice caps receded and remained confined to the
Antarctic and Greenland.
We have been in an interglacial period, called the Holocene, for the past 11,000 years. The various aspects of the
evolution of climate will be expanded upon later in this
book.
The last million years is the best understood geological
period, because climate can be reconstructed from detailed
information provided by polar ice and marine and continental sediments. Over this period, a succession of
oscillations between glacial and interglacial periods marks
intervals which are the result of small changes in the
Earth’s orbit around the Sun. The glacial periods last
almost ten times longer than the interglacial periods but
they are interspersed with rapid warmings which follow
the outbreaks of cold in the North Atlantic and neighboring landmasses. All these major climate shifts do not
occur as a result of chance and it is the work of climatologists and paleoclimatologists to understand them by
analyzing climate mechanisms and the causes of their
variability.
-0.8
-0.6
-0.4
-0.2
0
0.2
0.4
0.6
0.8
1850
1870
1890
1910
1930
1950
1970
1990
2010
-0.8
-0.6
-0.4
-0.2
0
0.2
0.4
0.6
0.8
1000
1100
1200
1300
1400
1500
1600
1700
1800
1900
2000
2.5
3
3.5
4
4.5
5
5.5
0
100
200
300
400
500
600
700
800
900
1000
570
225
65
1,8
0
chaud
actuel
froid
4600
3000
2000
1000
Ere
Primaire
Ere
Secondaire
Ere
Tertiaire
Age (Ma)
0
-130
Niveau
de la mer
(m)
Age (ka)
Ecart à la tempé rature moyenne (°C)
Age (AD)
Age (AD)
rature moyenne (°C)
Précambrien
A
B
C
D
Precambrian
Paleozoic
Era
Mesozoic
Era
Cenozoic
Era
hot
cold
present day
Isotopic composition of oxygen (δ
18 O , ‰)
Sea level
Time
Time
Time
Time
540
250
Fig. 1.1 a Variations in the
climate of Earth over the past
4 billion years, estimated from
geological data. b Changes in
mean climate estimated from
variations in the volume of
glaciers and ice sheets present on
the surface of continents for the
last million years. c Variations in
the average air temperature in the
northern hemisphere from the
year 1000 reconstructed from
paleoclimate data, including
historical data and the study of
tree rings. d Variations in the
average surface air temperature
calculated from the global
meteorological network data for
the period 1860–2010. Note that
the number of stations has varied
during this period and was sparse
throughout the late nineteenth
century
2
S. Joussaume and J.-C. Duplessy