

Each ring is measured and a set of between twenty and
forty time series is produced for each stand. As well as the
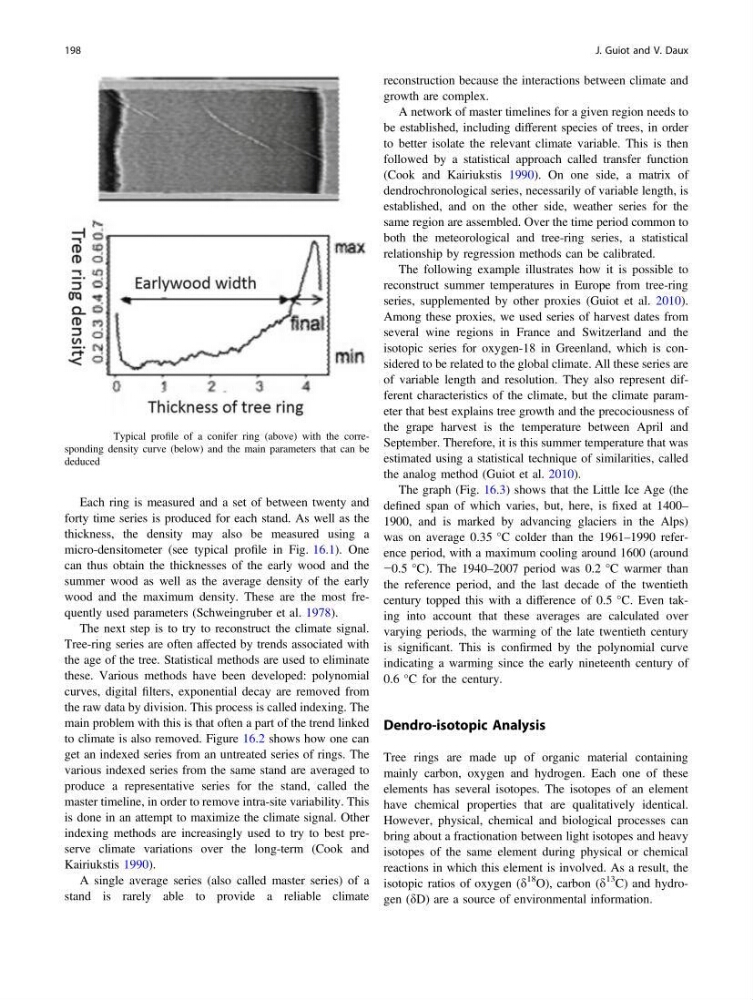
thickness, the density may also be measured using a
micro-densitometer (see typical profile in Fig. 16.1). One
can thus obtain the thicknesses of the early wood and the
summer wood as well as the average density of the early
wood and the maximum density. These are the most frequently used parameters (Schweingruber et al. 1978).
The next step is to try to reconstruct the climate signal.
Tree-ring series are often affected by trends associated with
the age of the tree. Statistical methods are used to eliminate
these. Various methods have been developed: polynomial
curves, digital filters, exponential decay are removed from
the raw data by division. This process is called indexing. The
main problem with this is that often a part of the trend linked
to climate is also removed. Figure 16.2 shows how one can
get an indexed series from an untreated series of rings. The
various indexed series from the same stand are averaged to
produce a representative series for the stand, called the
master timeline, in order to remove intra-site variability. This
is done in an attempt to maximize the climate signal. Other
indexing methods are increasingly used to try to best preserve climate variations over the long-term (Cook and
Kairiukstis 1990).
A single average series (also called master series) of a
stand is rarely able to provide a reliable climate
reconstruction because the interactions between climate and
growth are complex.
A network of master timelines for a given region needs to
be established, including different species of trees, in order
to better isolate the relevant climate variable. This is then
followed by a statistical approach called transfer function
(Cook and Kairiukstis 1990). On one side, a matrix of
dendrochronological series, necessarily of variable length, is
established, and on the other side, weather series for the
same region are assembled. Over the time period common to
both the meteorological and tree-ring series, a statistical
relationship by regression methods can be calibrated.
The following example illustrates how it is possible to
reconstruct summer temperatures in Europe from tree-ring
series, supplemented by other proxies (Guiot et al. 2010).
Among these proxies, we used series of harvest dates from
several wine regions in France and Switzerland and the
isotopic series for oxygen-18 in Greenland, which is considered to be related to the global climate. All these series are
of variable length and resolution. They also represent different characteristics of the climate, but the climate parameter that best explains tree growth and the precociousness of
the grape harvest is the temperature between April and
September. Therefore, it is this summer temperature that was
estimated using a statistical technique of similarities, called
the analog method (Guiot et al. 2010).
The graph (Fig. 16.3) shows that the Little Ice Age (the
defined span of which varies, but, here, is fixed at 1400–
1900, and is marked by advancing glaciers in the Alps)
was on average 0.35 °C colder than the 1961–1990 reference period, with a maximum cooling around 1600 (around
−0.5 °C). The 1940–2007 period was 0.2 °C warmer than
the reference period, and the last decade of the twentieth
century topped this with a difference of 0.5 °C. Even taking into account that these averages are calculated over
varying periods, the warming of the late twentieth century
is significant. This is confirmed by the polynomial curve
indicating a warming since the early nineteenth century of
0.6 °C for the century.
Dendro-isotopic Analysis
Tree rings are made up of organic material containing
mainly carbon, oxygen and hydrogen. Each one of these
elements has several isotopes. The isotopes of an element
have chemical properties that are qualitatively identical.
However, physical, chemical and biological processes can
bring about a fractionation between light isotopes and heavy
isotopes of the same element during physical or chemical
reactions in which this element is involved. As a result, the
isotopic ratios of oxygen (d
18 O), carbon (d
13
C) and hydrogen (dD) are a source of environmental information.
Fig. 16.1 Typical profile of a conifer ring (above) with the corresponding density curve (below) and the main parameters that can be
deduced
198
J. Guiot and V. Daux
forty time series is produced for each stand. As well as the
thickness, the density may also be measured using a
micro-densitometer (see typical profile in Fig. 16.1). One
can thus obtain the thicknesses of the early wood and the
summer wood as well as the average density of the early
wood and the maximum density. These are the most frequently used parameters (Schweingruber et al. 1978).
The next step is to try to reconstruct the climate signal.
Tree-ring series are often affected by trends associated with
the age of the tree. Statistical methods are used to eliminate
these. Various methods have been developed: polynomial
curves, digital filters, exponential decay are removed from
the raw data by division. This process is called indexing. The
main problem with this is that often a part of the trend linked
to climate is also removed. Figure 16.2 shows how one can
get an indexed series from an untreated series of rings. The
various indexed series from the same stand are averaged to
produce a representative series for the stand, called the
master timeline, in order to remove intra-site variability. This
is done in an attempt to maximize the climate signal. Other
indexing methods are increasingly used to try to best preserve climate variations over the long-term (Cook and
Kairiukstis 1990).
A single average series (also called master series) of a
stand is rarely able to provide a reliable climate
reconstruction because the interactions between climate and
growth are complex.
A network of master timelines for a given region needs to
be established, including different species of trees, in order
to better isolate the relevant climate variable. This is then
followed by a statistical approach called transfer function
(Cook and Kairiukstis 1990). On one side, a matrix of
dendrochronological series, necessarily of variable length, is
established, and on the other side, weather series for the
same region are assembled. Over the time period common to
both the meteorological and tree-ring series, a statistical
relationship by regression methods can be calibrated.
The following example illustrates how it is possible to
reconstruct summer temperatures in Europe from tree-ring
series, supplemented by other proxies (Guiot et al. 2010).
Among these proxies, we used series of harvest dates from
several wine regions in France and Switzerland and the
isotopic series for oxygen-18 in Greenland, which is considered to be related to the global climate. All these series are
of variable length and resolution. They also represent different characteristics of the climate, but the climate parameter that best explains tree growth and the precociousness of
the grape harvest is the temperature between April and
September. Therefore, it is this summer temperature that was
estimated using a statistical technique of similarities, called
the analog method (Guiot et al. 2010).
The graph (Fig. 16.3) shows that the Little Ice Age (the
defined span of which varies, but, here, is fixed at 1400–
1900, and is marked by advancing glaciers in the Alps)
was on average 0.35 °C colder than the 1961–1990 reference period, with a maximum cooling around 1600 (around
−0.5 °C). The 1940–2007 period was 0.2 °C warmer than
the reference period, and the last decade of the twentieth
century topped this with a difference of 0.5 °C. Even taking into account that these averages are calculated over
varying periods, the warming of the late twentieth century
is significant. This is confirmed by the polynomial curve
indicating a warming since the early nineteenth century of
0.6 °C for the century.
Dendro-isotopic Analysis
Tree rings are made up of organic material containing
mainly carbon, oxygen and hydrogen. Each one of these
elements has several isotopes. The isotopes of an element
have chemical properties that are qualitatively identical.
However, physical, chemical and biological processes can
bring about a fractionation between light isotopes and heavy
isotopes of the same element during physical or chemical
reactions in which this element is involved. As a result, the
isotopic ratios of oxygen (d
18 O), carbon (d
13
C) and hydrogen (dD) are a source of environmental information.
Fig. 16.1 Typical profile of a conifer ring (above) with the corresponding density curve (below) and the main parameters that can be
deduced
198
J. Guiot and V. Daux