

resolution comparable to that obtained in ice cores from
Greenland, with, however, some differences in the trends
caused by different climate gradients.
Paleoclimate Reconstruction: A Quantitative
Approach
During its growth, the speleothem calcite traps water in the
form of microscopic fluid inclusions (1–10 microns large)
or, more rarely, macroscopic ones (several mm). This water
comes from the rainwater contemporaneous to the calcite deposition and can therefore be dated indirectly by
dating the surrounding calcite. With an average composition
of only a few nL of water per gram of calcite, the technical
difficulties of extracting and analyzing this water have only
recently been resolved (Verheyden et al. 2008; Vonhof et al.
2006; Affolter et al. 2014; Arienzo et al. 2013). There are
many reasons for measuring the isotopic composition (dD,
d
18 O) of the fluid inclusions of speleothems: (1) the value of
the d
18 O of the inclusion water is close to that of the rainwater and so is a tracer of atmospheric circulation; (2) in
conjunction with the d
18 O c of the calcite, it is possible to
calculate the temperature of calcite formation in the cave,
which is equivalent to the average annual exterior temperature. For this second case, it is necessary for the calcite
precipitation to have occurred at thermodynamic equilibrium
(isotopic, by extension), in other words, that the exchanges
between the different carbon species (e.g.HCO
À
3 , CO
2À
3 ; CO 2
gas) have been completed.
Examples using this new technique are still rare, but are
among the only ones, on land, to express the evolution of
temperature (from direct measurements) over a precise
absolute time scale. A stalagmite from Peru has thus shown
that the isotopic composition of the rainwater followed the
local winter insolation (6° S) due to changes in the intensity
of convective rainfall during the Holocene, themselves
linked to latitudinal variations in the ITCZ (Van Breukelen
et al. 2008). The temperature, calculated using the above
method, varied little (±2 °C) over the last 13.5 ka, unlike at
higher latitudes, as is shown by another example from
Vancouver Island (Canada 49° N), where the temperature
has varied by more than 10°C between 6 ka and 10 ka
(Zhang et al. 2008).
However, this method cannot be applied to all speleothems. Indeed, conditions of low humidity or low pCO 2
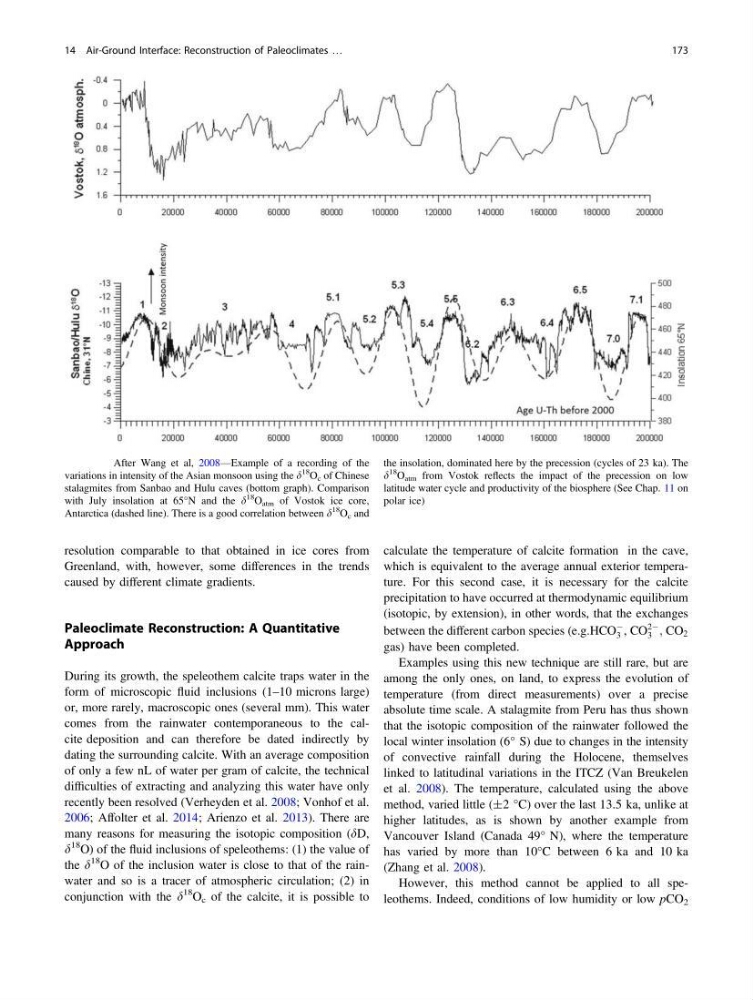
Fig. 14.2 After Wang et al, 2008—Example of a recording of the
variations in intensity of the Asian monsoon using the d
18
O c of Chinese
stalagmites from Sanbao and Hulu caves (bottom graph). Comparison
with July insolation at 65°N and the d
18
O atm of Vostok ice core,
Antarctica (dashed line). There is a good correlation between d
18
O c and
the insolation, dominated here by the precession (cycles of 23 ka). The
d
18
O atm from Vostok reflects the impact of the precession on low
latitude water cycle and productivity of the biosphere (See Chap. 11 on
polar ice)
14 Air-Ground Interface: Reconstruction of Paleoclimates …
173
Greenland, with, however, some differences in the trends
caused by different climate gradients.
Paleoclimate Reconstruction: A Quantitative
Approach
During its growth, the speleothem calcite traps water in the
form of microscopic fluid inclusions (1–10 microns large)
or, more rarely, macroscopic ones (several mm). This water
comes from the rainwater contemporaneous to the calcite deposition and can therefore be dated indirectly by
dating the surrounding calcite. With an average composition
of only a few nL of water per gram of calcite, the technical
difficulties of extracting and analyzing this water have only
recently been resolved (Verheyden et al. 2008; Vonhof et al.
2006; Affolter et al. 2014; Arienzo et al. 2013). There are
many reasons for measuring the isotopic composition (dD,
d
18 O) of the fluid inclusions of speleothems: (1) the value of
the d
18 O of the inclusion water is close to that of the rainwater and so is a tracer of atmospheric circulation; (2) in
conjunction with the d
18 O c of the calcite, it is possible to
calculate the temperature of calcite formation in the cave,
which is equivalent to the average annual exterior temperature. For this second case, it is necessary for the calcite
precipitation to have occurred at thermodynamic equilibrium
(isotopic, by extension), in other words, that the exchanges
between the different carbon species (e.g.HCO
À
3 , CO
2À
3 ; CO 2
gas) have been completed.
Examples using this new technique are still rare, but are
among the only ones, on land, to express the evolution of
temperature (from direct measurements) over a precise
absolute time scale. A stalagmite from Peru has thus shown
that the isotopic composition of the rainwater followed the
local winter insolation (6° S) due to changes in the intensity
of convective rainfall during the Holocene, themselves
linked to latitudinal variations in the ITCZ (Van Breukelen
et al. 2008). The temperature, calculated using the above
method, varied little (±2 °C) over the last 13.5 ka, unlike at
higher latitudes, as is shown by another example from
Vancouver Island (Canada 49° N), where the temperature
has varied by more than 10°C between 6 ka and 10 ka
(Zhang et al. 2008).
However, this method cannot be applied to all speleothems. Indeed, conditions of low humidity or low pCO 2
Fig. 14.2 After Wang et al, 2008—Example of a recording of the
variations in intensity of the Asian monsoon using the d
18
O c of Chinese
stalagmites from Sanbao and Hulu caves (bottom graph). Comparison
with July insolation at 65°N and the d
18
O atm of Vostok ice core,
Antarctica (dashed line). There is a good correlation between d
18
O c and
the insolation, dominated here by the precession (cycles of 23 ka). The
d
18
O atm from Vostok reflects the impact of the precession on low
latitude water cycle and productivity of the biosphere (See Chap. 11 on
polar ice)
14 Air-Ground Interface: Reconstruction of Paleoclimates …
173