

in sites with high winds and rugged relief (dunes) at the
surface.
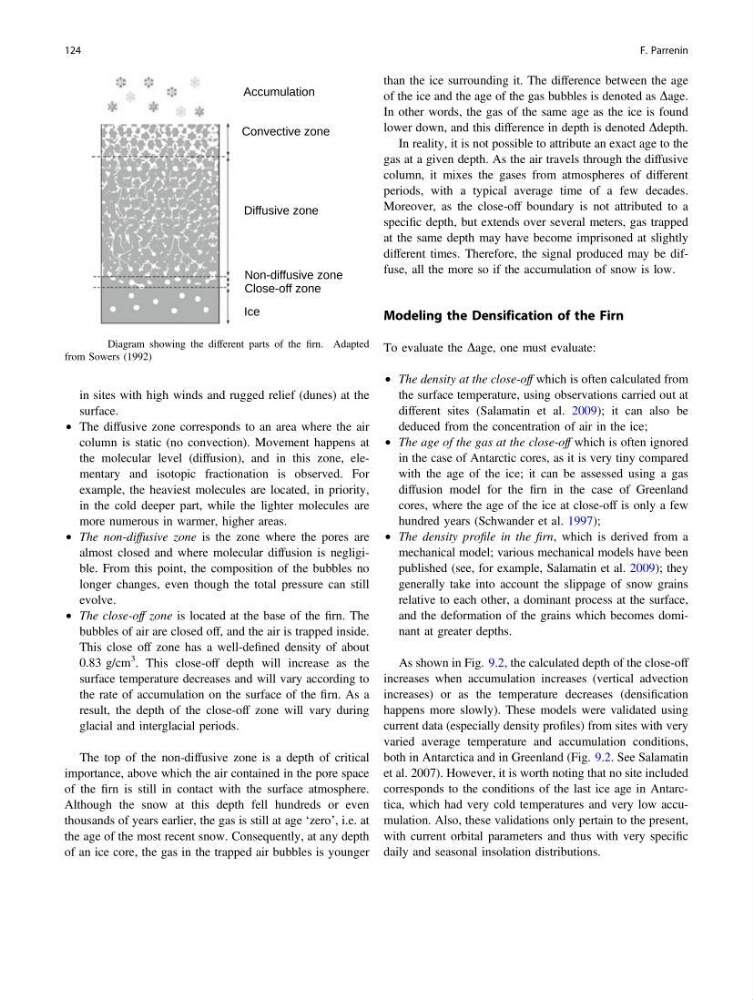
• The diffusive zone corresponds to an area where the air
column is static (no convection). Movement happens at
the molecular level (diffusion), and in this zone, elementary and isotopic fractionation is observed. For
example, the heaviest molecules are located, in priority,
in the cold deeper part, while the lighter molecules are
more numerous in warmer, higher areas.
• The non-diffusive zone is the zone where the pores are
almost closed and where molecular diffusion is negligible. From this point, the composition of the bubbles no
longer changes, even though the total pressure can still
evolve.
• The close-off zone is located at the base of the firn. The
bubbles of air are closed off, and the air is trapped inside.
This close off zone has a well-defined density of about
0.83 g/cm
3 . This close-off depth will increase as the
surface temperature decreases and will vary according to
the rate of accumulation on the surface of the firn. As a
result, the depth of the close-off zone will vary during
glacial and interglacial periods.
The top of the non-diffusive zone is a depth of critical
importance, above which the air contained in the pore space
of the firn is still in contact with the surface atmosphere.
Although the snow at this depth fell hundreds or even
thousands of years earlier, the gas is still at age ‘zero’, i.e. at
the age of the most recent snow. Consequently, at any depth
of an ice core, the gas in the trapped air bubbles is younger
than the ice surrounding it. The difference between the age
of the ice and the age of the gas bubbles is denoted as Dage.
In other words, the gas of the same age as the ice is found
lower down, and this difference in depth is denoted Ddepth.
In reality, it is not possible to attribute an exact age to the
gas at a given depth. As the air travels through the diffusive
column, it mixes the gases from atmospheres of different
periods, with a typical average time of a few decades.
Moreover, as the close-off boundary is not attributed to a
specific depth, but extends over several meters, gas trapped
at the same depth may have become imprisoned at slightly
different times. Therefore, the signal produced may be diffuse, all the more so if the accumulation of snow is low.
Modeling the Densification of the Firn
To evaluate the Dage, one must evaluate:
• The density at the close-off which is often calculated from
the surface temperature, using observations carried out at
different sites (Salamatin et al. 2009); it can also be
deduced from the concentration of air in the ice;
• The age of the gas at the close-off which is often ignored
in the case of Antarctic cores, as it is very tiny compared
with the age of the ice; it can be assessed using a gas
diffusion model for the firn in the case of Greenland
cores, where the age of the ice at close-off is only a few
hundred years (Schwander et al. 1997);
• The density profile in the firn, which is derived from a
mechanical model; various mechanical models have been
published (see, for example, Salamatin et al. 2009); they
generally take into account the slippage of snow grains
relative to each other, a dominant process at the surface,
and the deformation of the grains which becomes dominant at greater depths.
As shown in Fig. 9.2, the calculated depth of the close-off
increases when accumulation increases (vertical advection
increases) or as the temperature decreases (densification
happens more slowly). These models were validated using
current data (especially density profiles) from sites with very
varied average temperature and accumulation conditions,
both in Antarctica and in Greenland (Fig. 9.2. See Salamatin
et al. 2007). However, it is worth noting that no site included
corresponds to the conditions of the last ice age in Antarctica, which had very cold temperatures and very low accumulation. Also, these validations only pertain to the present,
with current orbital parameters and thus with very specific
daily and seasonal insolation distributions.
Fig. 9.1 Diagram showing the different parts of the firn. Adapted
from Sowers (1992)
124
F. Parrenin
surface.
• The diffusive zone corresponds to an area where the air
column is static (no convection). Movement happens at
the molecular level (diffusion), and in this zone, elementary and isotopic fractionation is observed. For
example, the heaviest molecules are located, in priority,
in the cold deeper part, while the lighter molecules are
more numerous in warmer, higher areas.
• The non-diffusive zone is the zone where the pores are
almost closed and where molecular diffusion is negligible. From this point, the composition of the bubbles no
longer changes, even though the total pressure can still
evolve.
• The close-off zone is located at the base of the firn. The
bubbles of air are closed off, and the air is trapped inside.
This close off zone has a well-defined density of about
0.83 g/cm
3 . This close-off depth will increase as the
surface temperature decreases and will vary according to
the rate of accumulation on the surface of the firn. As a
result, the depth of the close-off zone will vary during
glacial and interglacial periods.
The top of the non-diffusive zone is a depth of critical
importance, above which the air contained in the pore space
of the firn is still in contact with the surface atmosphere.
Although the snow at this depth fell hundreds or even
thousands of years earlier, the gas is still at age ‘zero’, i.e. at
the age of the most recent snow. Consequently, at any depth
of an ice core, the gas in the trapped air bubbles is younger
than the ice surrounding it. The difference between the age
of the ice and the age of the gas bubbles is denoted as Dage.
In other words, the gas of the same age as the ice is found
lower down, and this difference in depth is denoted Ddepth.
In reality, it is not possible to attribute an exact age to the
gas at a given depth. As the air travels through the diffusive
column, it mixes the gases from atmospheres of different
periods, with a typical average time of a few decades.
Moreover, as the close-off boundary is not attributed to a
specific depth, but extends over several meters, gas trapped
at the same depth may have become imprisoned at slightly
different times. Therefore, the signal produced may be diffuse, all the more so if the accumulation of snow is low.
Modeling the Densification of the Firn
To evaluate the Dage, one must evaluate:
• The density at the close-off which is often calculated from
the surface temperature, using observations carried out at
different sites (Salamatin et al. 2009); it can also be
deduced from the concentration of air in the ice;
• The age of the gas at the close-off which is often ignored
in the case of Antarctic cores, as it is very tiny compared
with the age of the ice; it can be assessed using a gas
diffusion model for the firn in the case of Greenland
cores, where the age of the ice at close-off is only a few
hundred years (Schwander et al. 1997);
• The density profile in the firn, which is derived from a
mechanical model; various mechanical models have been
published (see, for example, Salamatin et al. 2009); they
generally take into account the slippage of snow grains
relative to each other, a dominant process at the surface,
and the deformation of the grains which becomes dominant at greater depths.
As shown in Fig. 9.2, the calculated depth of the close-off
increases when accumulation increases (vertical advection
increases) or as the temperature decreases (densification
happens more slowly). These models were validated using
current data (especially density profiles) from sites with very
varied average temperature and accumulation conditions,
both in Antarctica and in Greenland (Fig. 9.2. See Salamatin
et al. 2007). However, it is worth noting that no site included
corresponds to the conditions of the last ice age in Antarctica, which had very cold temperatures and very low accumulation. Also, these validations only pertain to the present,
with current orbital parameters and thus with very specific
daily and seasonal insolation distributions.
Fig. 9.1 Diagram showing the different parts of the firn. Adapted
from Sowers (1992)
124
F. Parrenin