

44
S. Droulias and L. Bougas
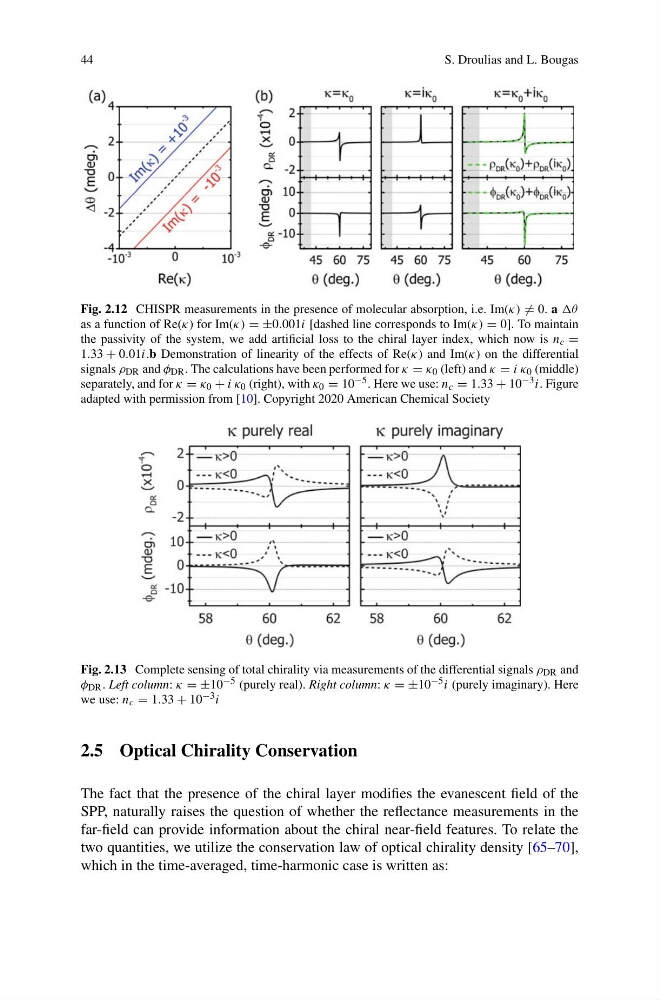
Fig. 2.12 CHISPR measurements in the presence of molecular absorption, i.e. Im(κ) = 0. a θ
as a function of Re(κ) for Im(κ) = ±0.001i [dashed line corresponds to Im(κ) = 0]. To maintain
the passivity of the system, we add artificial loss to the chiral layer index, which now is n c =
1.33 + 0.01i.b Demonstration of linearity of the effects of Re(κ) and Im(κ) on the differential
signals ρ DR and φ DR . The calculations have been performed for κ = κ 0 (left) and κ = i κ 0 (middle)
separately, and for κ = κ 0 + i κ 0 (right), with κ 0 = 10 −5 . Here we use: n c = 1.33 + 10 −3 i. Figure
adapted with permission from [10]. Copyright 2020 American Chemical Society
Fig. 2.13 Complete sensing of total chirality via measurements of the differential signals ρ DR and
φ DR . Left column: κ = ±10 −5 (purely real). Right column: κ = ±10 −5 i (purely imaginary). Here
we use: n c = 1.33 + 10 −3 i
2.5 Optical Chirality Conservation
The fact that the presence of the chiral layer modifies the evanescent field of the
SPP, naturally raises the question of whether the reflectance measurements in the
far-field can provide information about the chiral near-field features. To relate the
two quantities, we utilize the conservation law of optical chirality density [65–70],
which in the time-averaged, time-harmonic case is written as:
S. Droulias and L. Bougas
Fig. 2.12 CHISPR measurements in the presence of molecular absorption, i.e. Im(κ) = 0. a θ
as a function of Re(κ) for Im(κ) = ±0.001i [dashed line corresponds to Im(κ) = 0]. To maintain
the passivity of the system, we add artificial loss to the chiral layer index, which now is n c =
1.33 + 0.01i.b Demonstration of linearity of the effects of Re(κ) and Im(κ) on the differential
signals ρ DR and φ DR . The calculations have been performed for κ = κ 0 (left) and κ = i κ 0 (middle)
separately, and for κ = κ 0 + i κ 0 (right), with κ 0 = 10 −5 . Here we use: n c = 1.33 + 10 −3 i. Figure
adapted with permission from [10]. Copyright 2020 American Chemical Society
Fig. 2.13 Complete sensing of total chirality via measurements of the differential signals ρ DR and
φ DR . Left column: κ = ±10 −5 (purely real). Right column: κ = ±10 −5 i (purely imaginary). Here
we use: n c = 1.33 + 10 −3 i
2.5 Optical Chirality Conservation
The fact that the presence of the chiral layer modifies the evanescent field of the
SPP, naturally raises the question of whether the reflectance measurements in the
far-field can provide information about the chiral near-field features. To relate the
two quantities, we utilize the conservation law of optical chirality density [65–70],
which in the time-averaged, time-harmonic case is written as: