

424
Z. Li et al.
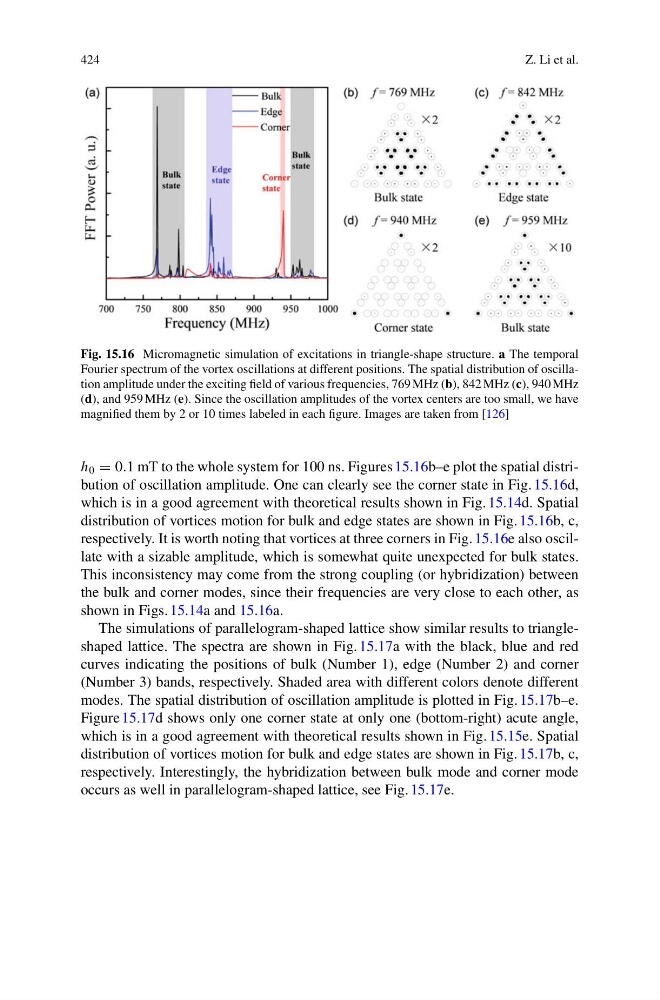
Fig. 15.16 Micromagnetic simulation of excitations in triangle-shape structure. a The temporal
Fourier spectrum of the vortex oscillations at different positions. The spatial distribution of oscillation amplitude under the exciting field of various frequencies, 769 MHz (b), 842 MHz (c), 940 MHz
(d), and 959 MHz (e). Since the oscillation amplitudes of the vortex centers are too small, we have
magnified them by 2 or 10 times labeled in each figure. Images are taken from [126]
h 0 = 0.1 mT to the whole system for 100 ns. Figures 15.16b–e plot the spatial distribution of oscillation amplitude. One can clearly see the corner state in Fig. 15.16d,
which is in a good agreement with theoretical results shown in Fig. 15.14d. Spatial
distribution of vortices motion for bulk and edge states are shown in Fig. 15.16b, c,
respectively. It is worth noting that vortices at three corners in Fig. 15.16e also oscillate with a sizable amplitude, which is somewhat quite unexpected for bulk states.
This inconsistency may come from the strong coupling (or hybridization) between
the bulk and corner modes, since their frequencies are very close to each other, as
shown in Figs. 15.14a and 15.16a.
The simulations of parallelogram-shaped lattice show similar results to triangleshaped lattice. The spectra are shown in Fig. 15.17a with the black, blue and red
curves indicating the positions of bulk (Number 1), edge (Number 2) and corner
(Number 3) bands, respectively. Shaded area with different colors denote different
modes. The spatial distribution of oscillation amplitude is plotted in Fig. 15.17b–e.
Figure 15.17d shows only one corner state at only one (bottom-right) acute angle,
which is in a good agreement with theoretical results shown in Fig. 15.15e. Spatial
distribution of vortices motion for bulk and edge states are shown in Fig. 15.17b, c,
respectively. Interestingly, the hybridization between bulk mode and corner mode
occurs as well in parallelogram-shaped lattice, see Fig. 15.17e.
Z. Li et al.
Fig. 15.16 Micromagnetic simulation of excitations in triangle-shape structure. a The temporal
Fourier spectrum of the vortex oscillations at different positions. The spatial distribution of oscillation amplitude under the exciting field of various frequencies, 769 MHz (b), 842 MHz (c), 940 MHz
(d), and 959 MHz (e). Since the oscillation amplitudes of the vortex centers are too small, we have
magnified them by 2 or 10 times labeled in each figure. Images are taken from [126]
h 0 = 0.1 mT to the whole system for 100 ns. Figures 15.16b–e plot the spatial distribution of oscillation amplitude. One can clearly see the corner state in Fig. 15.16d,
which is in a good agreement with theoretical results shown in Fig. 15.14d. Spatial
distribution of vortices motion for bulk and edge states are shown in Fig. 15.16b, c,
respectively. It is worth noting that vortices at three corners in Fig. 15.16e also oscillate with a sizable amplitude, which is somewhat quite unexpected for bulk states.
This inconsistency may come from the strong coupling (or hybridization) between
the bulk and corner modes, since their frequencies are very close to each other, as
shown in Figs. 15.14a and 15.16a.
The simulations of parallelogram-shaped lattice show similar results to triangleshaped lattice. The spectra are shown in Fig. 15.17a with the black, blue and red
curves indicating the positions of bulk (Number 1), edge (Number 2) and corner
(Number 3) bands, respectively. Shaded area with different colors denote different
modes. The spatial distribution of oscillation amplitude is plotted in Fig. 15.17b–e.
Figure 15.17d shows only one corner state at only one (bottom-right) acute angle,
which is in a good agreement with theoretical results shown in Fig. 15.15e. Spatial
distribution of vortices motion for bulk and edge states are shown in Fig. 15.17b, c,
respectively. Interestingly, the hybridization between bulk mode and corner mode
occurs as well in parallelogram-shaped lattice, see Fig. 15.17e.