

19 Mud Shrinkage and Cracking Phenomenon Experimental …
399
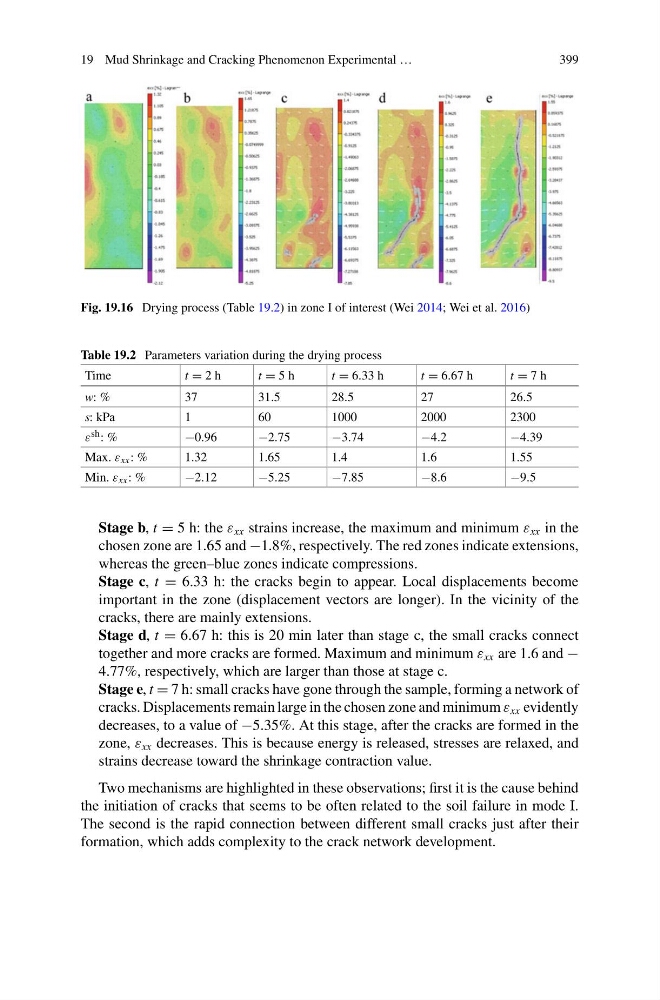
Fig. 19.16 Drying process (Table 19.2) in zone I of interest (Wei 2014; Wei et al. 2016)
Table 19.2 Parameters variation during the drying process
Time
t = 2 h
t = 5 h
t = 6.33 h
t = 6.67 h
t = 7 h
w: %
37
31.5
28.5
27
26.5
s: kPa
1
60
1000
2000
2300
ε sh : %
−0.96
−2.75
−3.74
−4.2
−4.39
Max. ε xx : %
1.32
1.65
1.4
1.6
1.55
Min. ε xx : %
−2.12
−5.25
−7.85
−8.6
−9.5
Stage b, t = 5 h: the ε xx strains increase, the maximum and minimum ε xx in the
chosen zone are 1.65 and −1.8%, respectively. The red zones indicate extensions,
whereas the green–blue zones indicate compressions.
Stage c, t = 6.33 h: the cracks begin to appear. Local displacements become
important in the zone (displacement vectors are longer). In the vicinity of the
cracks, there are mainly extensions.
Stage d, t = 6.67 h: this is 20 min later than stage c, the small cracks connect
together and more cracks are formed. Maximum and minimum ε xx are 1.6 and −
4.77%, respectively, which are larger than those at stage c.
Stage e, t = 7 h: small cracks have gone through the sample, forming a network of
cracks. Displacements remain large in the chosen zone and minimum ε xx evidently
decreases, to a value of −5.35%. At this stage, after the cracks are formed in the
zone, ε xx decreases. This is because energy is released, stresses are relaxed, and
strains decrease toward the shrinkage contraction value.
Two mechanisms are highlighted in these observations; first it is the cause behind
the initiation of cracks that seems to be often related to the soil failure in mode I.
The second is the rapid connection between different small cracks just after their
formation, which adds complexity to the crack network development.
399
Fig. 19.16 Drying process (Table 19.2) in zone I of interest (Wei 2014; Wei et al. 2016)
Table 19.2 Parameters variation during the drying process
Time
t = 2 h
t = 5 h
t = 6.33 h
t = 6.67 h
t = 7 h
w: %
37
31.5
28.5
27
26.5
s: kPa
1
60
1000
2000
2300
ε sh : %
−0.96
−2.75
−3.74
−4.2
−4.39
Max. ε xx : %
1.32
1.65
1.4
1.6
1.55
Min. ε xx : %
−2.12
−5.25
−7.85
−8.6
−9.5
Stage b, t = 5 h: the ε xx strains increase, the maximum and minimum ε xx in the
chosen zone are 1.65 and −1.8%, respectively. The red zones indicate extensions,
whereas the green–blue zones indicate compressions.
Stage c, t = 6.33 h: the cracks begin to appear. Local displacements become
important in the zone (displacement vectors are longer). In the vicinity of the
cracks, there are mainly extensions.
Stage d, t = 6.67 h: this is 20 min later than stage c, the small cracks connect
together and more cracks are formed. Maximum and minimum ε xx are 1.6 and −
4.77%, respectively, which are larger than those at stage c.
Stage e, t = 7 h: small cracks have gone through the sample, forming a network of
cracks. Displacements remain large in the chosen zone and minimum ε xx evidently
decreases, to a value of −5.35%. At this stage, after the cracks are formed in the
zone, ε xx decreases. This is because energy is released, stresses are relaxed, and
strains decrease toward the shrinkage contraction value.
Two mechanisms are highlighted in these observations; first it is the cause behind
the initiation of cracks that seems to be often related to the soil failure in mode I.
The second is the rapid connection between different small cracks just after their
formation, which adds complexity to the crack network development.