

398
M. Hattab et al.
equal to −12%. In this map, two cracks were developed, one from the longitudinal
(x-axis) edge of the sample, the other at the center.
Figure 19.14b shows the crack initiated from the top edge of the sample, the map
being represented in terms of mechanical strains. One can see here a zoom of ε
*
xx
field map as well as the map of the principal strain directions. The zone appears in
extension toward the x direction, especially around the crack, where larger strains
are captured, which appear perpendicular to the development of the crack. This
result draws the signature of cracking in Mode I. The crack is developed in opening
mode and was initiated when the concentrated tensile stresses exceeded the material
capillary cohesive strength.
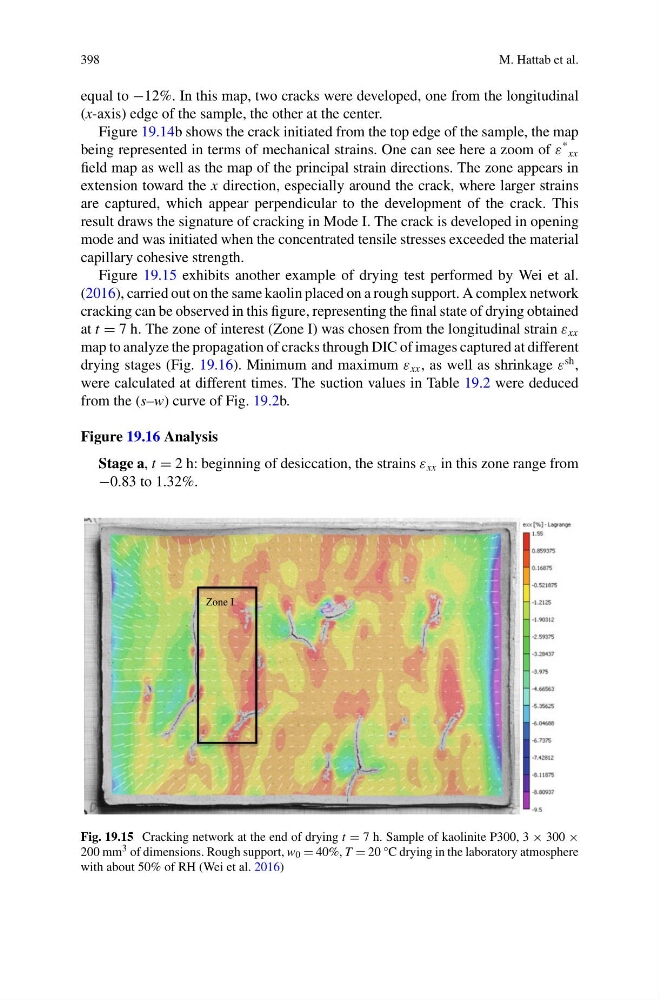
Figure 19.15 exhibits another example of drying test performed by Wei et al.
(2016), carried out on the same kaolin placed on a rough support. A complex network
cracking can be observed in this figure, representing the final state of drying obtained
at t = 7 h. The zone of interest (Zone I) was chosen from the longitudinal strain ε xx
map to analyze the propagation of cracks through DIC of images captured at different
drying stages (Fig. 19.16). Minimum and maximum ε xx , as well as shrinkage ε
sh ,
were calculated at different times. The suction values in Table 19.2 were deduced
from the (s–w) curve of Fig. 19.2b.
Figure 19.16 Analysis
Stage a, t = 2 h: beginning of desiccation, the strains ε xx in this zone range from
−0.83 to 1.32%.
Zone I
Fig. 19.15 Cracking network at the end of drying t = 7 h. Sample of kaolinite P300, 3 × 300 ×
200 mm 3 of dimensions. Rough support, w 0 = 40%, T = 20 °C drying in the laboratory atmosphere
with about 50% of RH (Wei et al. 2016)
M. Hattab et al.
equal to −12%. In this map, two cracks were developed, one from the longitudinal
(x-axis) edge of the sample, the other at the center.
Figure 19.14b shows the crack initiated from the top edge of the sample, the map
being represented in terms of mechanical strains. One can see here a zoom of ε
*
xx
field map as well as the map of the principal strain directions. The zone appears in
extension toward the x direction, especially around the crack, where larger strains
are captured, which appear perpendicular to the development of the crack. This
result draws the signature of cracking in Mode I. The crack is developed in opening
mode and was initiated when the concentrated tensile stresses exceeded the material
capillary cohesive strength.
Figure 19.15 exhibits another example of drying test performed by Wei et al.
(2016), carried out on the same kaolin placed on a rough support. A complex network
cracking can be observed in this figure, representing the final state of drying obtained
at t = 7 h. The zone of interest (Zone I) was chosen from the longitudinal strain ε xx
map to analyze the propagation of cracks through DIC of images captured at different
drying stages (Fig. 19.16). Minimum and maximum ε xx , as well as shrinkage ε
sh ,
were calculated at different times. The suction values in Table 19.2 were deduced
from the (s–w) curve of Fig. 19.2b.
Figure 19.16 Analysis
Stage a, t = 2 h: beginning of desiccation, the strains ε xx in this zone range from
−0.83 to 1.32%.
Zone I
Fig. 19.15 Cracking network at the end of drying t = 7 h. Sample of kaolinite P300, 3 × 300 ×
200 mm 3 of dimensions. Rough support, w 0 = 40%, T = 20 °C drying in the laboratory atmosphere
with about 50% of RH (Wei et al. 2016)