

18 A Plausible Description of Continuum …
361
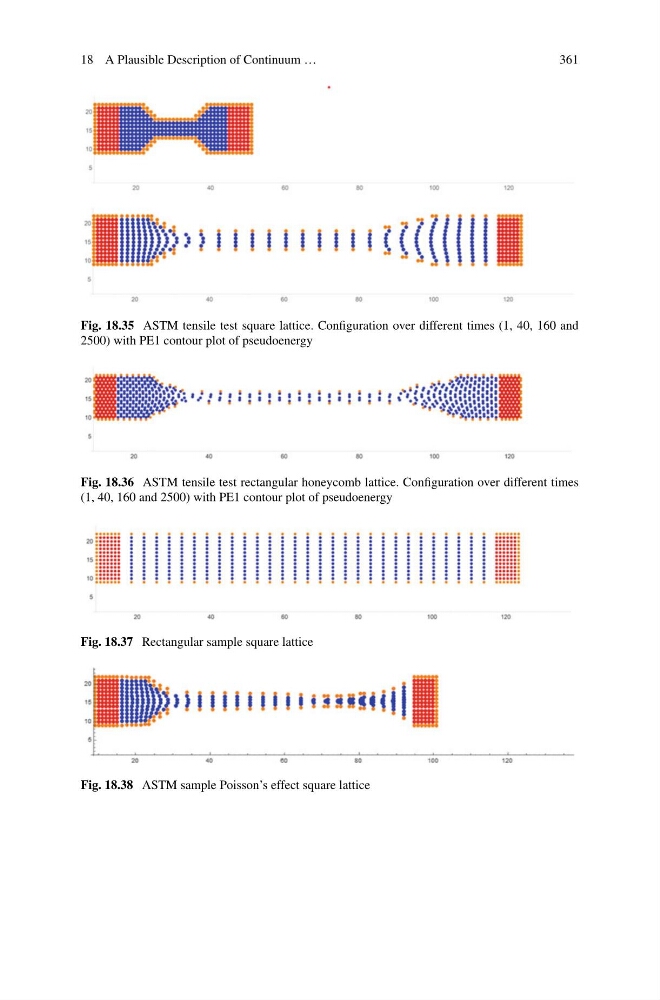
Fig. 18.35 ASTM tensile test square lattice. Configuration over different times (1, 40, 160 and
2500) with PE1 contour plot of pseudoenergy
Fig. 18.36 ASTM tensile test rectangular honeycomb lattice. Configuration over different times
(1, 40, 160 and 2500) with PE1 contour plot of pseudoenergy
Fig. 18.37 Rectangular sample square lattice
Fig. 18.38 ASTM sample Poisson’s effect square lattice
361
Fig. 18.35 ASTM tensile test square lattice. Configuration over different times (1, 40, 160 and
2500) with PE1 contour plot of pseudoenergy
Fig. 18.36 ASTM tensile test rectangular honeycomb lattice. Configuration over different times
(1, 40, 160 and 2500) with PE1 contour plot of pseudoenergy
Fig. 18.37 Rectangular sample square lattice
Fig. 18.38 ASTM sample Poisson’s effect square lattice