

18 A Plausible Description of Continuum …
347
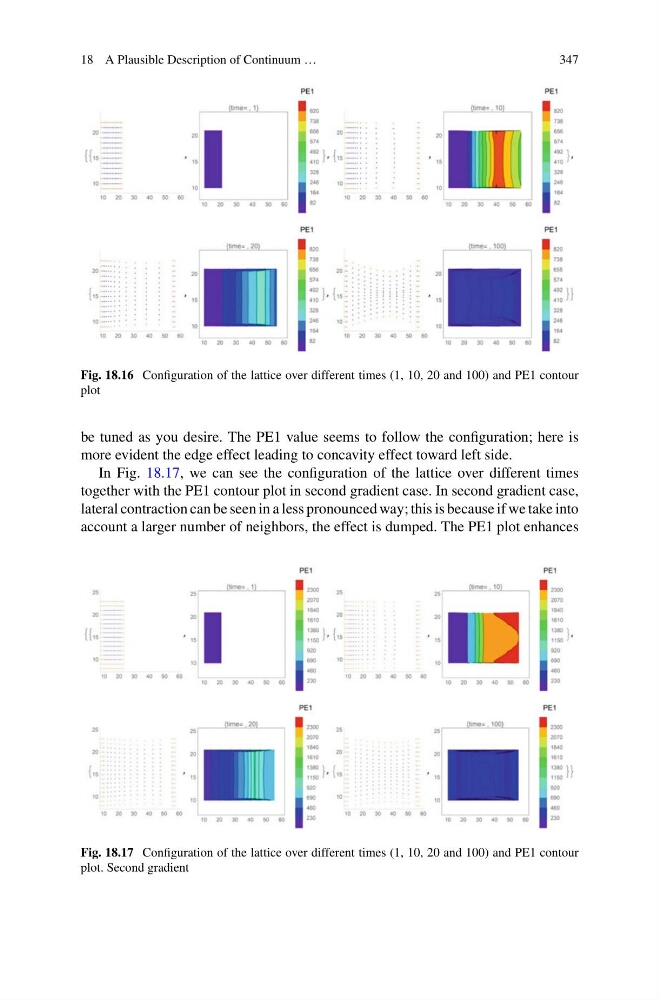
Fig. 18.16 Configuration of the lattice over different times (1, 10, 20 and 100) and PE1 contour
plot
be tuned as you desire. The PE1 value seems to follow the configuration; here is
more evident the edge effect leading to concavity effect toward left side.
In Fig. 18.17, we can see the configuration of the lattice over different times
together with the PE1 contour plot in second gradient case. In second gradient case,
lateral contraction can be seen in a less pronounced way; this is because if we take into
account a larger number of neighbors, the effect is dumped. The PE1 plot enhances
Fig. 18.17 Configuration of the lattice over different times (1, 10, 20 and 100) and PE1 contour
plot. Second gradient
347
Fig. 18.16 Configuration of the lattice over different times (1, 10, 20 and 100) and PE1 contour
plot
be tuned as you desire. The PE1 value seems to follow the configuration; here is
more evident the edge effect leading to concavity effect toward left side.
In Fig. 18.17, we can see the configuration of the lattice over different times
together with the PE1 contour plot in second gradient case. In second gradient case,
lateral contraction can be seen in a less pronounced way; this is because if we take into
account a larger number of neighbors, the effect is dumped. The PE1 plot enhances
Fig. 18.17 Configuration of the lattice over different times (1, 10, 20 and 100) and PE1 contour
plot. Second gradient