

18 A Plausible Description of Continuum …
343
Case (a1) Simple stress test
This was the first simple test we have investigated. Consider a square-shaped specimen subjected to pull and release in tensile test. We are considering a sample undergoing strain from one side (the other side is clamped) at constant velocity in xdirection (speed 0.6 unit length/step time), with a square lattice 10 × 10 particles
unit. At a certain time, the pull is released and the leaders return to original configuration (this means that leaders have changed category and now they are followers)
attracted by the other points. The simple rule, governing follower’s motion is that
every point must be placed in the barycenter of its neighbors (Eq. 18.1); the neighbors are determined by the coordination number of the square lattice; therefore, the
leader’s motion implies a displacement of the first layer that propagates in successive time steps to the other particles. Therefore, the displacements, at each time step,
involve a larger shell of points until to regards all the lattice points. In second gradient
(Diziol et al. 2011; Ladevèze 2012; Steigmann 2013), we consider also the neighbors
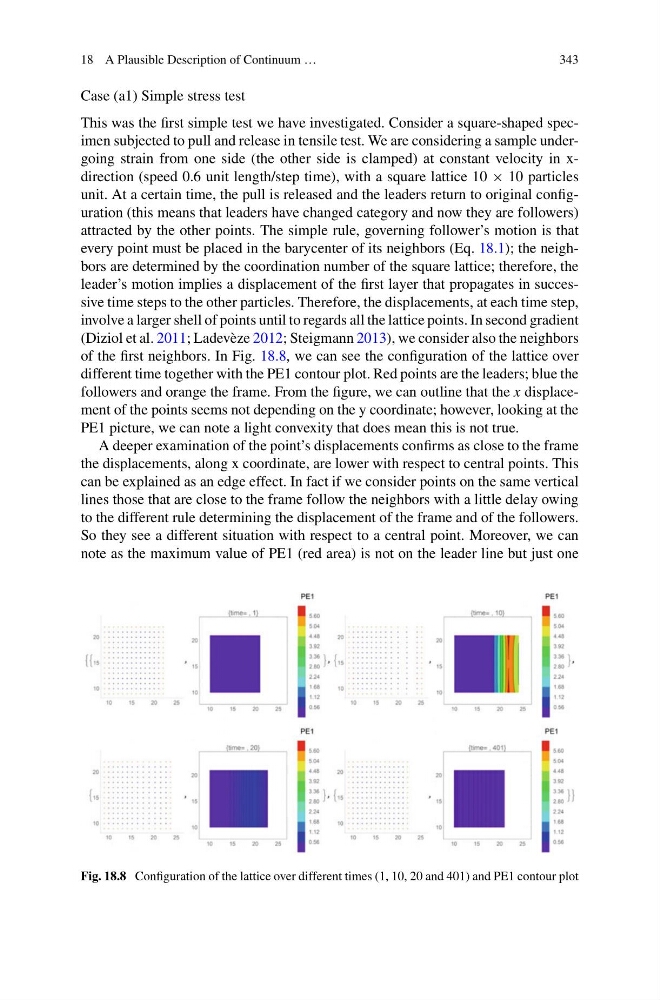
of the first neighbors. In Fig. 18.8, we can see the configuration of the lattice over
different time together with the PE1 contour plot. Red points are the leaders; blue the
followers and orange the frame. From the figure, we can outline that the x displacement of the points seems not depending on the y coordinate; however, looking at the
PE1 picture, we can note a light convexity that does mean this is not true.
A deeper examination of the point’s displacements confirms as close to the frame
the displacements, along x coordinate, are lower with respect to central points. This
can be explained as an edge effect. In fact if we consider points on the same vertical
lines those that are close to the frame follow the neighbors with a little delay owing
to the different rule determining the displacement of the frame and of the followers.
So they see a different situation with respect to a central point. Moreover, we can
note as the maximum value of PE1 (red area) is not on the leader line but just one
Fig. 18.8 Configuration of the lattice over different times (1, 10, 20 and 401) and PE1 contour plot
343
Case (a1) Simple stress test
This was the first simple test we have investigated. Consider a square-shaped specimen subjected to pull and release in tensile test. We are considering a sample undergoing strain from one side (the other side is clamped) at constant velocity in xdirection (speed 0.6 unit length/step time), with a square lattice 10 × 10 particles
unit. At a certain time, the pull is released and the leaders return to original configuration (this means that leaders have changed category and now they are followers)
attracted by the other points. The simple rule, governing follower’s motion is that
every point must be placed in the barycenter of its neighbors (Eq. 18.1); the neighbors are determined by the coordination number of the square lattice; therefore, the
leader’s motion implies a displacement of the first layer that propagates in successive time steps to the other particles. Therefore, the displacements, at each time step,
involve a larger shell of points until to regards all the lattice points. In second gradient
(Diziol et al. 2011; Ladevèze 2012; Steigmann 2013), we consider also the neighbors
of the first neighbors. In Fig. 18.8, we can see the configuration of the lattice over
different time together with the PE1 contour plot. Red points are the leaders; blue the
followers and orange the frame. From the figure, we can outline that the x displacement of the points seems not depending on the y coordinate; however, looking at the
PE1 picture, we can note a light convexity that does mean this is not true.
A deeper examination of the point’s displacements confirms as close to the frame
the displacements, along x coordinate, are lower with respect to central points. This
can be explained as an edge effect. In fact if we consider points on the same vertical
lines those that are close to the frame follow the neighbors with a little delay owing
to the different rule determining the displacement of the frame and of the followers.
So they see a different situation with respect to a central point. Moreover, we can
note as the maximum value of PE1 (red area) is not on the leader line but just one
Fig. 18.8 Configuration of the lattice over different times (1, 10, 20 and 401) and PE1 contour plot