

234
R. dell’Erba
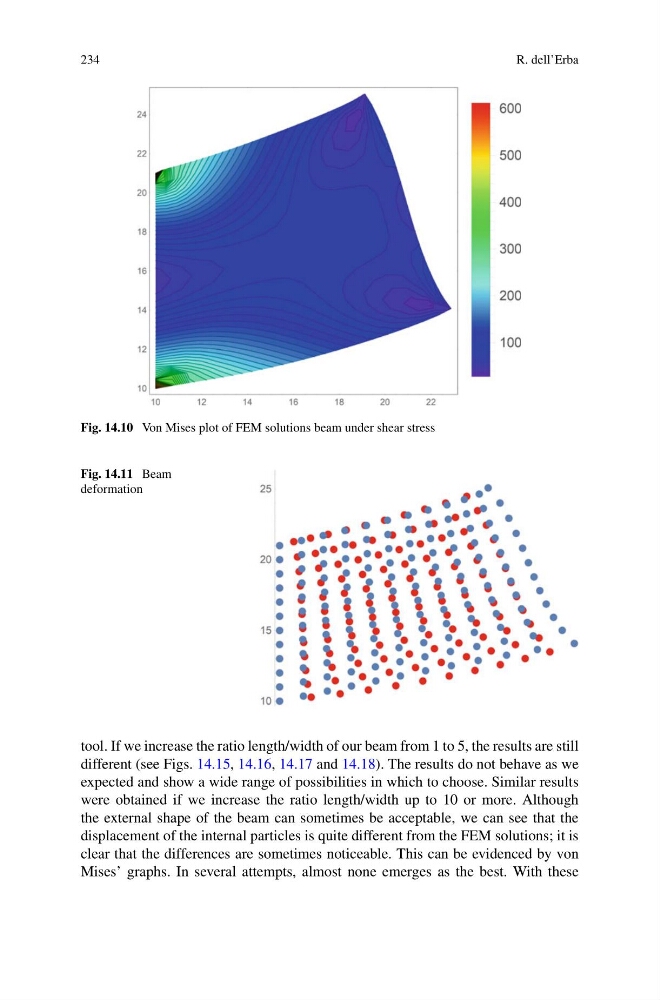
Fig. 14.10 Von Mises plot of FEM solutions beam under shear stress
Fig. 14.11 Beam
deformation
tool. If we increase the ratio length/width of our beam from 1 to 5, the results are still
different (see Figs. 14.15, 14.16, 14.17 and 14.18). The results do not behave as we
expected and show a wide range of possibilities in which to choose. Similar results
were obtained if we increase the ratio length/width up to 10 or more. Although
the external shape of the beam can sometimes be acceptable, we can see that the
displacement of the internal particles is quite different from the FEM solutions; it is
clear that the differences are sometimes noticeable. This can be evidenced by von
Mises’ graphs. In several attempts, almost none emerges as the best. With these
R. dell’Erba
Fig. 14.10 Von Mises plot of FEM solutions beam under shear stress
Fig. 14.11 Beam
deformation
tool. If we increase the ratio length/width of our beam from 1 to 5, the results are still
different (see Figs. 14.15, 14.16, 14.17 and 14.18). The results do not behave as we
expected and show a wide range of possibilities in which to choose. Similar results
were obtained if we increase the ratio length/width up to 10 or more. Although
the external shape of the beam can sometimes be acceptable, we can see that the
displacement of the internal particles is quite different from the FEM solutions; it is
clear that the differences are sometimes noticeable. This can be evidenced by von
Mises’ graphs. In several attempts, almost none emerges as the best. With these