

218
A. V. Basalin et al.
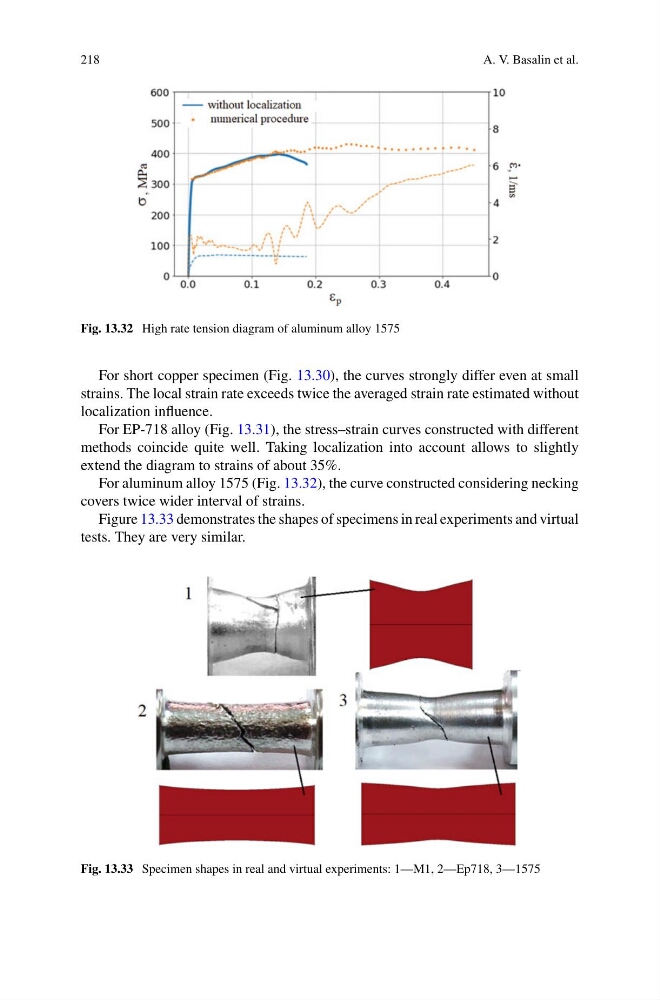
Fig. 13.32 High rate tension diagram of aluminum alloy 1575
For short copper specimen (Fig. 13.30), the curves strongly differ even at small
strains. The local strain rate exceeds twice the averaged strain rate estimated without
localization influence.
For EP-718 alloy (Fig. 13.31), the stress–strain curves constructed with different
methods coincide quite well. Taking localization into account allows to slightly
extend the diagram to strains of about 35%.
For aluminum alloy 1575 (Fig. 13.32), the curve constructed considering necking
covers twice wider interval of strains.
Figure 13.33 demonstrates the shapes of specimens in real experiments and virtual
tests. They are very similar.
Fig. 13.33 Specimen shapes in real and virtual experiments: 1—M1, 2—Ep718, 3—1575
A. V. Basalin et al.
Fig. 13.32 High rate tension diagram of aluminum alloy 1575
For short copper specimen (Fig. 13.30), the curves strongly differ even at small
strains. The local strain rate exceeds twice the averaged strain rate estimated without
localization influence.
For EP-718 alloy (Fig. 13.31), the stress–strain curves constructed with different
methods coincide quite well. Taking localization into account allows to slightly
extend the diagram to strains of about 35%.
For aluminum alloy 1575 (Fig. 13.32), the curve constructed considering necking
covers twice wider interval of strains.
Figure 13.33 demonstrates the shapes of specimens in real experiments and virtual
tests. They are very similar.
Fig. 13.33 Specimen shapes in real and virtual experiments: 1—M1, 2—Ep718, 3—1575