

216
A. V. Basalin et al.
It should be noted that the specified algorithm converges quickly enough, even with
a not very successful choice of the initial approximation of the deformation curve
(the model with a constant flow stress was used in the example).
13.4.4 Testing the Procedure on Experiments
Firstly, the procedure was tested on virtual experiments described in Sect. 13.4.1.
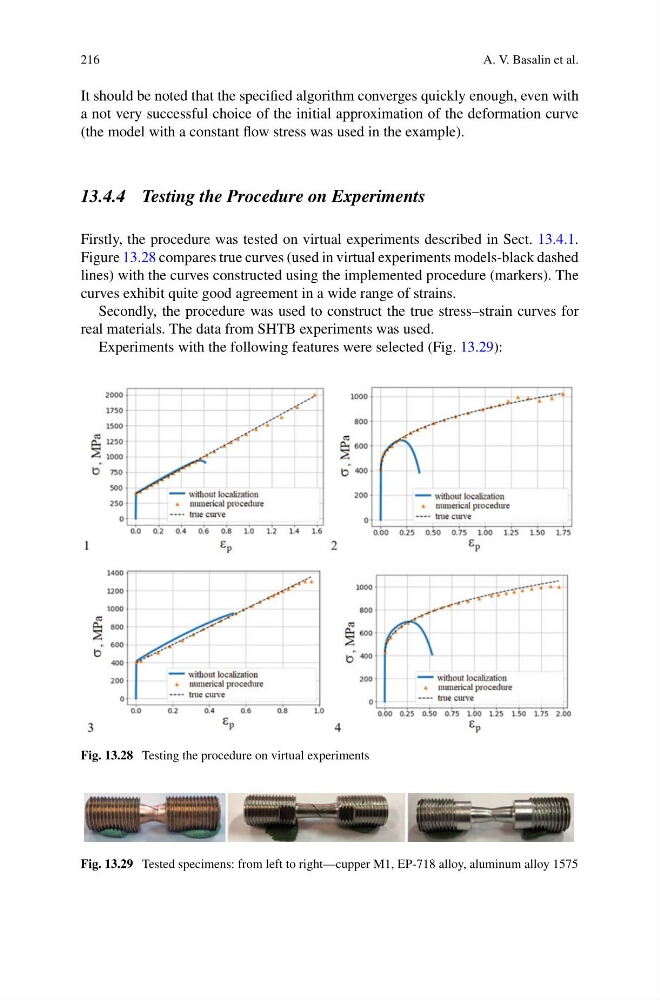
Figure 13.28 compares true curves (used in virtual experiments models-black dashed
lines) with the curves constructed using the implemented procedure (markers). The
curves exhibit quite good agreement in a wide range of strains.
Secondly, the procedure was used to construct the true stress–strain curves for
real materials. The data from SHTB experiments was used.
Experiments with the following features were selected (Fig. 13.29):
Fig. 13.28 Testing the procedure on virtual experiments
Fig. 13.29 Tested specimens: from left to right—cupper M1, EP-718 alloy, aluminum alloy 1575
A. V. Basalin et al.
It should be noted that the specified algorithm converges quickly enough, even with
a not very successful choice of the initial approximation of the deformation curve
(the model with a constant flow stress was used in the example).
13.4.4 Testing the Procedure on Experiments
Firstly, the procedure was tested on virtual experiments described in Sect. 13.4.1.
Figure 13.28 compares true curves (used in virtual experiments models-black dashed
lines) with the curves constructed using the implemented procedure (markers). The
curves exhibit quite good agreement in a wide range of strains.
Secondly, the procedure was used to construct the true stress–strain curves for
real materials. The data from SHTB experiments was used.
Experiments with the following features were selected (Fig. 13.29):
Fig. 13.28 Testing the procedure on virtual experiments
Fig. 13.29 Tested specimens: from left to right—cupper M1, EP-718 alloy, aluminum alloy 1575