

204
A. V. Basalin et al.
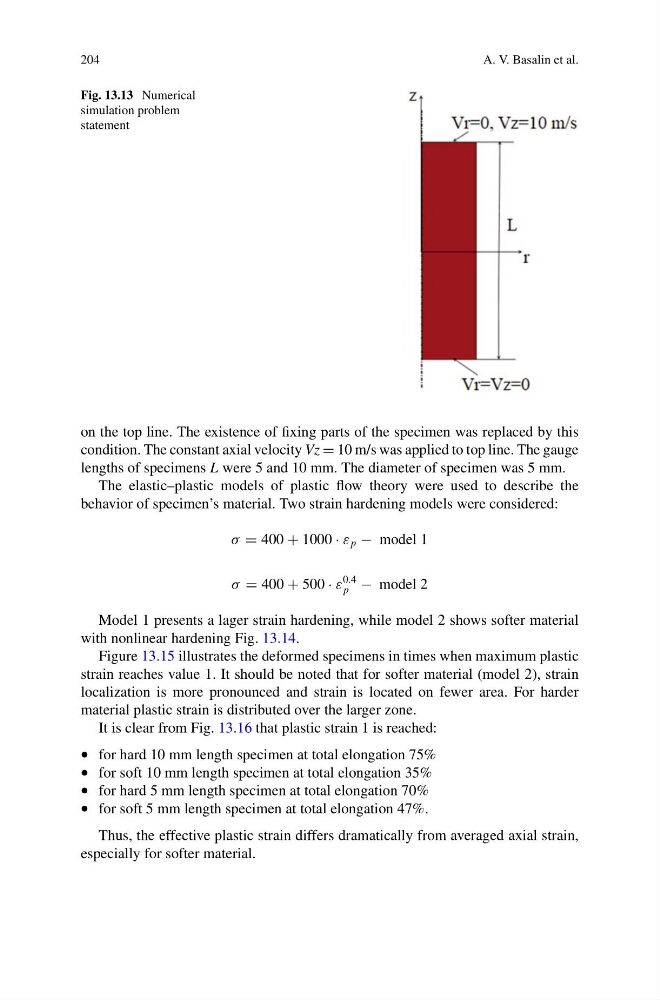
Fig. 13.13 Numerical
simulation problem
statement
on the top line. The existence of fixing parts of the specimen was replaced by this
condition. The constant axial velocity Vz = 10 m/s was applied to top line. The gauge
lengths of specimens L were 5 and 10 mm. The diameter of specimen was 5 mm.
The elastic–plastic models of plastic flow theory were used to describe the
behavior of specimen’s material. Two strain hardening models were considered:
σ = 400 + 1000 · ε p − model 1
σ = 400 + 500 · ε
0.4
p − model 2
Model 1 presents a lager strain hardening, while model 2 shows softer material
with nonlinear hardening Fig. 13.14.
Figure 13.15 illustrates the deformed specimens in times when maximum plastic
strain reaches value 1. It should be noted that for softer material (model 2), strain
localization is more pronounced and strain is located on fewer area. For harder
material plastic strain is distributed over the larger zone.
It is clear from Fig. 13.16 that plastic strain 1 is reached:
• for hard 10 mm length specimen at total elongation 75%
• for soft 10 mm length specimen at total elongation 35%
• for hard 5 mm length specimen at total elongation 70%
• for soft 5 mm length specimen at total elongation 47%.
Thus, the effective plastic strain differs dramatically from averaged axial strain,
especially for softer material.
A. V. Basalin et al.
Fig. 13.13 Numerical
simulation problem
statement
on the top line. The existence of fixing parts of the specimen was replaced by this
condition. The constant axial velocity Vz = 10 m/s was applied to top line. The gauge
lengths of specimens L were 5 and 10 mm. The diameter of specimen was 5 mm.
The elastic–plastic models of plastic flow theory were used to describe the
behavior of specimen’s material. Two strain hardening models were considered:
σ = 400 + 1000 · ε p − model 1
σ = 400 + 500 · ε
0.4
p − model 2
Model 1 presents a lager strain hardening, while model 2 shows softer material
with nonlinear hardening Fig. 13.14.
Figure 13.15 illustrates the deformed specimens in times when maximum plastic
strain reaches value 1. It should be noted that for softer material (model 2), strain
localization is more pronounced and strain is located on fewer area. For harder
material plastic strain is distributed over the larger zone.
It is clear from Fig. 13.16 that plastic strain 1 is reached:
• for hard 10 mm length specimen at total elongation 75%
• for soft 10 mm length specimen at total elongation 35%
• for hard 5 mm length specimen at total elongation 70%
• for soft 5 mm length specimen at total elongation 47%.
Thus, the effective plastic strain differs dramatically from averaged axial strain,
especially for softer material.