

200
A. V. Basalin et al.
13.4 True Stress–Strain Determination from the Tension
Experiments Data
13.4.1 The Models for Estimation of Stress and Strains
in Neck
The integral forces acting on the specimen and the specimen gauge elongation are
determined during the test. In the traditional method, an assumption of stress and
strain fields uniformity is introduced to calculate stresses and strains based on forces
and size changes. Therefore, it is only applicable till the moment of plastic strain
localization (necking). This leads to losing a large part of stress–strain curve after
the necking process.
The experimental and numerical analyses of specimen size effect on obtained
stress–strain curves in impact tension experiments were carried out in (Konstantinov
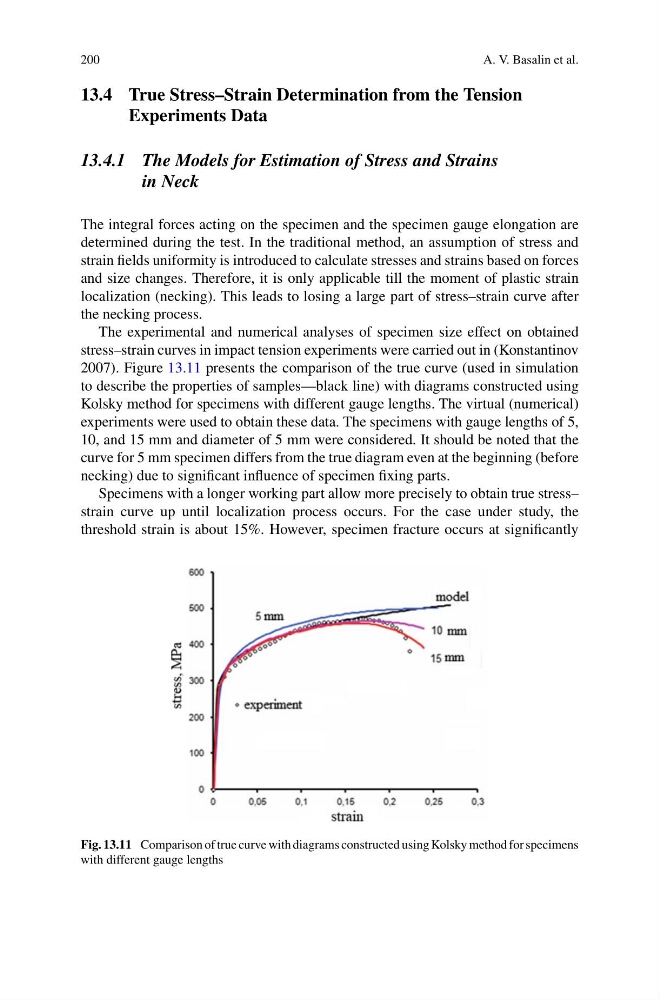
2007). Figure 13.11 presents the comparison of the true curve (used in simulation
to describe the properties of samples—black line) with diagrams constructed using
Kolsky method for specimens with different gauge lengths. The virtual (numerical)
experiments were used to obtain these data. The specimens with gauge lengths of 5,
10, and 15 mm and diameter of 5 mm were considered. It should be noted that the
curve for 5 mm specimen differs from the true diagram even at the beginning (before
necking) due to significant influence of specimen fixing parts.
Specimens with a longer working part allow more precisely to obtain true stress–
strain curve up until localization process occurs. For the case under study, the
threshold strain is about 15%. However, specimen fracture occurs at significantly
Fig. 13.11 Comparison of true curve with diagrams constructed using Kolsky method for specimens
with different gauge lengths
A. V. Basalin et al.
13.4 True Stress–Strain Determination from the Tension
Experiments Data
13.4.1 The Models for Estimation of Stress and Strains
in Neck
The integral forces acting on the specimen and the specimen gauge elongation are
determined during the test. In the traditional method, an assumption of stress and
strain fields uniformity is introduced to calculate stresses and strains based on forces
and size changes. Therefore, it is only applicable till the moment of plastic strain
localization (necking). This leads to losing a large part of stress–strain curve after
the necking process.
The experimental and numerical analyses of specimen size effect on obtained
stress–strain curves in impact tension experiments were carried out in (Konstantinov
2007). Figure 13.11 presents the comparison of the true curve (used in simulation
to describe the properties of samples—black line) with diagrams constructed using
Kolsky method for specimens with different gauge lengths. The virtual (numerical)
experiments were used to obtain these data. The specimens with gauge lengths of 5,
10, and 15 mm and diameter of 5 mm were considered. It should be noted that the
curve for 5 mm specimen differs from the true diagram even at the beginning (before
necking) due to significant influence of specimen fixing parts.
Specimens with a longer working part allow more precisely to obtain true stress–
strain curve up until localization process occurs. For the case under study, the
threshold strain is about 15%. However, specimen fracture occurs at significantly
Fig. 13.11 Comparison of true curve with diagrams constructed using Kolsky method for specimens
with different gauge lengths