

198
A. V. Basalin et al.
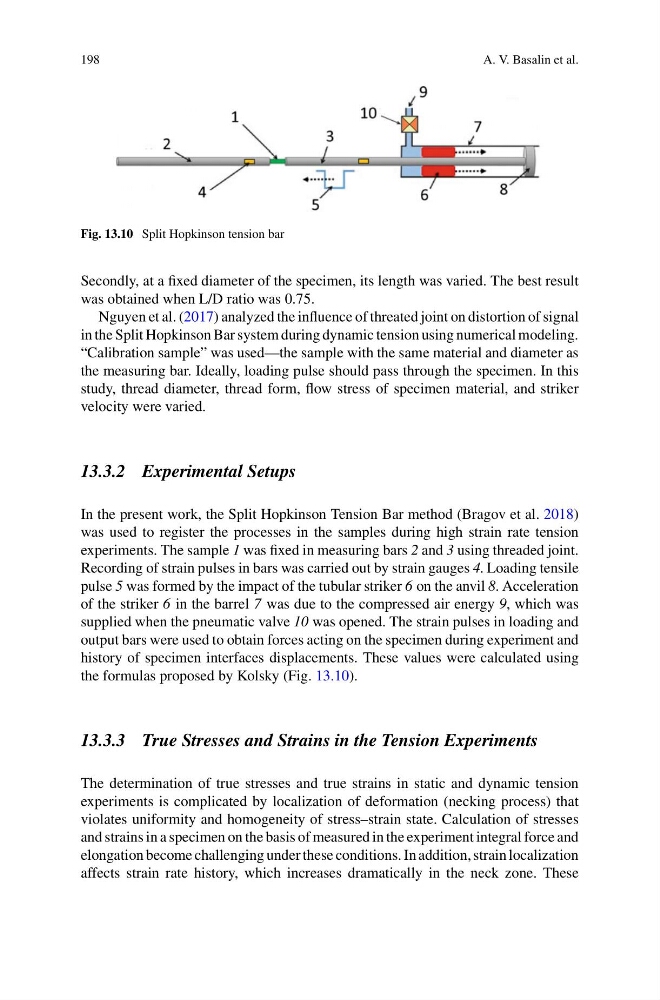
Fig. 13.10 Split Hopkinson tension bar
Secondly, at a fixed diameter of the specimen, its length was varied. The best result
was obtained when L/D ratio was 0.75.
Nguyen et al. (2017) analyzed the influence of threated joint on distortion of signal
in the Split Hopkinson Bar system during dynamic tension using numerical modeling.
“Calibration sample” was used—the sample with the same material and diameter as
the measuring bar. Ideally, loading pulse should pass through the specimen. In this
study, thread diameter, thread form, flow stress of specimen material, and striker
velocity were varied.
13.3.2 Experimental Setups
In the present work, the Split Hopkinson Tension Bar method (Bragov et al. 2018)
was used to register the processes in the samples during high strain rate tension
experiments. The sample 1 was fixed in measuring bars 2 and 3 using threaded joint.
Recording of strain pulses in bars was carried out by strain gauges 4. Loading tensile
pulse 5 was formed by the impact of the tubular striker 6 on the anvil 8. Acceleration
of the striker 6 in the barrel 7 was due to the compressed air energy 9, which was
supplied when the pneumatic valve 10 was opened. The strain pulses in loading and
output bars were used to obtain forces acting on the specimen during experiment and
history of specimen interfaces displacements. These values were calculated using
the formulas proposed by Kolsky (Fig. 13.10).
13.3.3 True Stresses and Strains in the Tension Experiments
The determination of true stresses and true strains in static and dynamic tension
experiments is complicated by localization of deformation (necking process) that
violates uniformity and homogeneity of stress–strain state. Calculation of stresses
and strains in a specimen on the basis of measured in the experiment integral force and
elongation become challenging under these conditions. In addition, strain localization
affects strain rate history, which increases dramatically in the neck zone. These
A. V. Basalin et al.
Fig. 13.10 Split Hopkinson tension bar
Secondly, at a fixed diameter of the specimen, its length was varied. The best result
was obtained when L/D ratio was 0.75.
Nguyen et al. (2017) analyzed the influence of threated joint on distortion of signal
in the Split Hopkinson Bar system during dynamic tension using numerical modeling.
“Calibration sample” was used—the sample with the same material and diameter as
the measuring bar. Ideally, loading pulse should pass through the specimen. In this
study, thread diameter, thread form, flow stress of specimen material, and striker
velocity were varied.
13.3.2 Experimental Setups
In the present work, the Split Hopkinson Tension Bar method (Bragov et al. 2018)
was used to register the processes in the samples during high strain rate tension
experiments. The sample 1 was fixed in measuring bars 2 and 3 using threaded joint.
Recording of strain pulses in bars was carried out by strain gauges 4. Loading tensile
pulse 5 was formed by the impact of the tubular striker 6 on the anvil 8. Acceleration
of the striker 6 in the barrel 7 was due to the compressed air energy 9, which was
supplied when the pneumatic valve 10 was opened. The strain pulses in loading and
output bars were used to obtain forces acting on the specimen during experiment and
history of specimen interfaces displacements. These values were calculated using
the formulas proposed by Kolsky (Fig. 13.10).
13.3.3 True Stresses and Strains in the Tension Experiments
The determination of true stresses and true strains in static and dynamic tension
experiments is complicated by localization of deformation (necking process) that
violates uniformity and homogeneity of stress–strain state. Calculation of stresses
and strains in a specimen on the basis of measured in the experiment integral force and
elongation become challenging under these conditions. In addition, strain localization
affects strain rate history, which increases dramatically in the neck zone. These