

184
L. Igumnov et al.
а
b
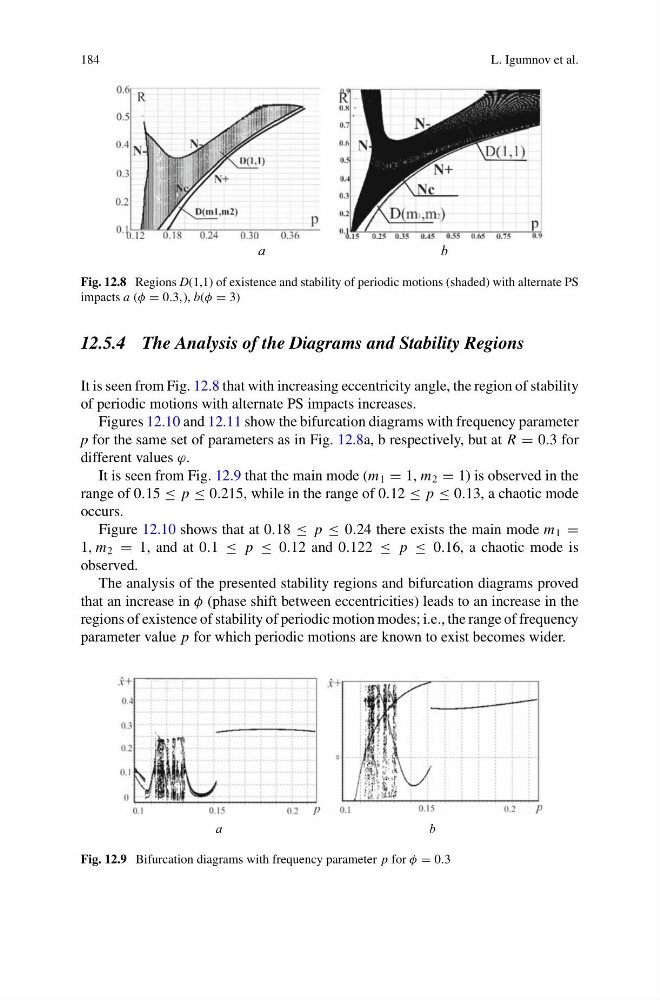
Fig. 12.8 Regions D(1,1) of existence and stability of periodic motions (shaded) with alternate PS
impacts a (φ = 0.3,), b(φ = 3)
12.5.4 The Analysis of the Diagrams and Stability Regions
It is seen from Fig. 12.8 that with increasing eccentricity angle, the region of stability
of periodic motions with alternate PS impacts increases.
Figures 12.10 and 12.11 show the bifurcation diagrams with frequency parameter
p for the same set of parameters as in Fig. 12.8a, b respectively, but at R = 0.3 for
different values ϕ.
It is seen from Fig. 12.9 that the main mode (m 1 = 1, m 2 = 1) is observed in the
range of 0.15 ≤ p ≤ 0.215, while in the range of 0.12 ≤ p ≤ 0.13, a chaotic mode
occurs.
Figure 12.10 shows that at 0.18 ≤ p ≤ 0.24 there exists the main mode m 1 =
1, m 2 = 1, and at 0.1 ≤ p ≤ 0.12 and 0.122 ≤ p ≤ 0.16, a chaotic mode is
observed.
The analysis of the presented stability regions and bifurcation diagrams proved
that an increase in φ (phase shift between eccentricities) leads to an increase in the
regions of existence of stability of periodic motion modes; i.e., the range of frequency
parameter value p for which periodic motions are known to exist becomes wider.
а
b
Fig. 12.9 Bifurcation diagrams with frequency parameter p for φ = 0.3
L. Igumnov et al.
а
b
Fig. 12.8 Regions D(1,1) of existence and stability of periodic motions (shaded) with alternate PS
impacts a (φ = 0.3,), b(φ = 3)
12.5.4 The Analysis of the Diagrams and Stability Regions
It is seen from Fig. 12.8 that with increasing eccentricity angle, the region of stability
of periodic motions with alternate PS impacts increases.
Figures 12.10 and 12.11 show the bifurcation diagrams with frequency parameter
p for the same set of parameters as in Fig. 12.8a, b respectively, but at R = 0.3 for
different values ϕ.
It is seen from Fig. 12.9 that the main mode (m 1 = 1, m 2 = 1) is observed in the
range of 0.15 ≤ p ≤ 0.215, while in the range of 0.12 ≤ p ≤ 0.13, a chaotic mode
occurs.
Figure 12.10 shows that at 0.18 ≤ p ≤ 0.24 there exists the main mode m 1 =
1, m 2 = 1, and at 0.1 ≤ p ≤ 0.12 and 0.122 ≤ p ≤ 0.16, a chaotic mode is
observed.
The analysis of the presented stability regions and bifurcation diagrams proved
that an increase in φ (phase shift between eccentricities) leads to an increase in the
regions of existence of stability of periodic motion modes; i.e., the range of frequency
parameter value p for which periodic motions are known to exist becomes wider.
а
b
Fig. 12.9 Bifurcation diagrams with frequency parameter p for φ = 0.3