

203
H
C
d
≈ 1 2
(7.1)
where C is a constant. This simple dependence must break down
at the smallest grain sizes. (If it did not, the strength would exceed
the ideal strength if the grains were made small enough.) Indeed,
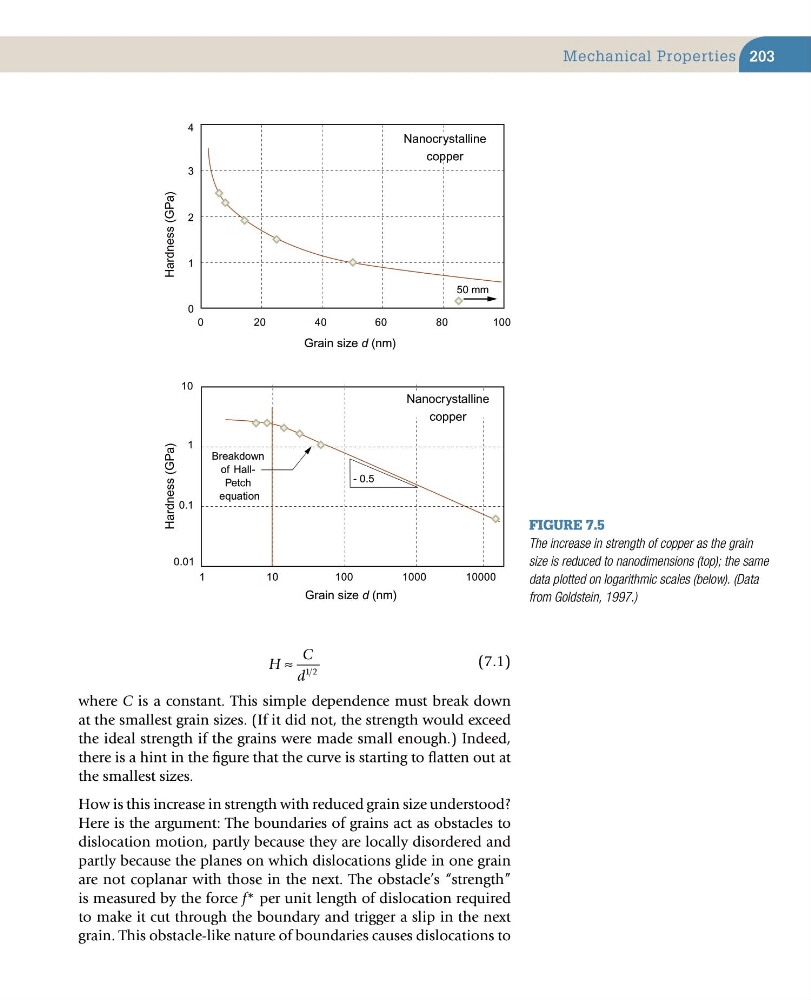
there is a hint in the figure that the curve is starting to flatten out at
the smallest sizes.
How is this increase in strength with reduced grain size understood?
Here is the argument: The boundaries of grains act as obstacles to
dislocation motion, partly because they are locally disordered and
partly because the planes on which dislocations glide in one grain
are not coplanar with those in the next. The obstacle’s “strength”
is measured by the force f* per unit length of dislocation required
to make it cut through the boundary and trigger a slip in the next
grain. This obstacle-like nature of boundaries causes dislocations to
Figure 7.5
The increase in strength of copper as the grain
size is reduced to nanodimensions (top); the same
data plotted on logarithmic scales (below). (Data
from Goldstein, 1997.)
0
1
2
3
4
0
20
40
60
80
100
0.01
0.1
1
10
1
10
100
1000
10000
Grain size d (nm)
Grain size d (nm)
Hardness (GPa)
Hardness (GPa)
50 mm
- 0.5
Nanocrystalline
copper
Nanocrystalline
copper
Breakdown
of HallPetch
equation
Mechanical Properties
H
C
d
≈ 1 2
(7.1)
where C is a constant. This simple dependence must break down
at the smallest grain sizes. (If it did not, the strength would exceed
the ideal strength if the grains were made small enough.) Indeed,
there is a hint in the figure that the curve is starting to flatten out at
the smallest sizes.
How is this increase in strength with reduced grain size understood?
Here is the argument: The boundaries of grains act as obstacles to
dislocation motion, partly because they are locally disordered and
partly because the planes on which dislocations glide in one grain
are not coplanar with those in the next. The obstacle’s “strength”
is measured by the force f* per unit length of dislocation required
to make it cut through the boundary and trigger a slip in the next
grain. This obstacle-like nature of boundaries causes dislocations to
Figure 7.5
The increase in strength of copper as the grain
size is reduced to nanodimensions (top); the same
data plotted on logarithmic scales (below). (Data
from Goldstein, 1997.)
0
1
2
3
4
0
20
40
60
80
100
0.01
0.1
1
10
1
10
100
1000
10000
Grain size d (nm)
Grain size d (nm)
Hardness (GPa)
Hardness (GPa)
50 mm
- 0.5
Nanocrystalline
copper
Nanocrystalline
copper
Breakdown
of HallPetch
equation
Mechanical Properties