

C hapter 4 Material Classes, structure, and properties
128
Magnetic fields in Materials
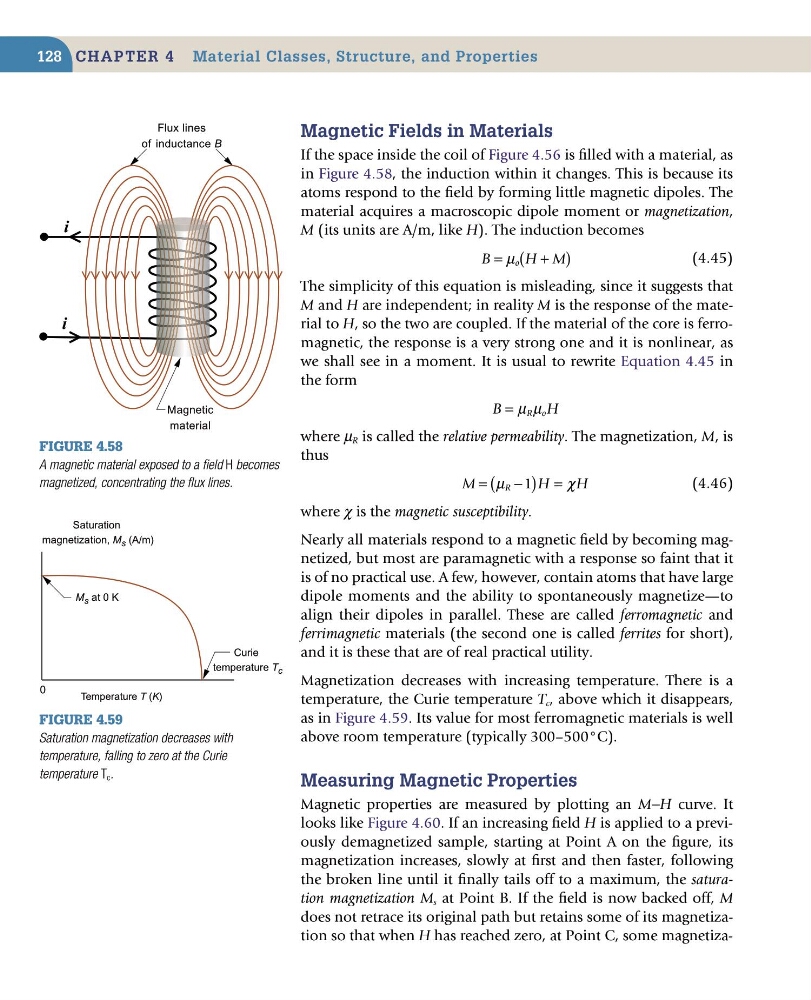
If the space inside the coil of Figure 4.56 is filled with a material, as
in Figure 4.58, the induction within it changes. This is because its
atoms respond to the field by forming little magnetic dipoles. The
material acquires a macroscopic dipole moment or magnetization,
M (its units are A/m, like H). The induction becomes
B
H M
o
=
+
(
)
µ
(4.45)
The simplicity of this equation is misleading, since it suggests that
M and H are independent; in reality M is the response of the material to H, so the two are coupled. If the material of the core is ferromagnetic, the response is a very strong one and it is nonlinear, as
we shall see in a moment. It is usual to rewrite Equation 4.45 in
the form
B
H
R o
= µ µ
where µ R is called the relative permeability. The magnetization, M, is
thus
M
H
H
R
=
−
(
) =
µ
χ
1
(4.46)
where χ is the magnetic susceptibility.
Nearly all materials respond to a magnetic field by becoming magnetized, but most are paramagnetic with a response so faint that it
is of no practical use. A few, however, contain atoms that have large
dipole moments and the ability to spontaneously magnetize—to
align their dipoles in parallel. These are called ferromagnetic and
ferrimagnetic materials (the second one is called ferrites for short),
and it is these that are of real practical utility.
Magnetization decreases with increasing temperature. There is a
temperature, the Curie temperature T c , above which it disappears,
as in Figure 4.59. Its value for most ferromagnetic materials is well
above room temperature (typically 300–500°C).
Measuring Magnetic properties
Magnetic properties are measured by plotting an M−H curve. It
looks like Figure 4.60. If an increasing field H is applied to a previously demagnetized sample, starting at Point A on the figure, its
magnetization increases, slowly at first and then faster, following
the broken line until it finally tails off to a maximum, the saturation magnetization M s at Point B. If the field is now backed off, M
does not retrace its original path but retains some of its magnetization so that when H has reached zero, at Point C, some magnetizaFigure 4.59
Saturation magnetization decreases with
temperature, falling to zero at the Curie
temperature T c .
Saturation
magnetization, M s (A/m)
Temperature T (K)
Curie
temperature T c
M s at 0 K
0
Figure 4.58
A magnetic material exposed to a field H becomes
magnetized, concentrating the flux lines.
i
i
Flux lines
of inductance B
Magnetic
material
128
Magnetic fields in Materials
If the space inside the coil of Figure 4.56 is filled with a material, as
in Figure 4.58, the induction within it changes. This is because its
atoms respond to the field by forming little magnetic dipoles. The
material acquires a macroscopic dipole moment or magnetization,
M (its units are A/m, like H). The induction becomes
B
H M
o
=
+
(
)
µ
(4.45)
The simplicity of this equation is misleading, since it suggests that
M and H are independent; in reality M is the response of the material to H, so the two are coupled. If the material of the core is ferromagnetic, the response is a very strong one and it is nonlinear, as
we shall see in a moment. It is usual to rewrite Equation 4.45 in
the form
B
H
R o
= µ µ
where µ R is called the relative permeability. The magnetization, M, is
thus
M
H
H
R
=
−
(
) =
µ
χ
1
(4.46)
where χ is the magnetic susceptibility.
Nearly all materials respond to a magnetic field by becoming magnetized, but most are paramagnetic with a response so faint that it
is of no practical use. A few, however, contain atoms that have large
dipole moments and the ability to spontaneously magnetize—to
align their dipoles in parallel. These are called ferromagnetic and
ferrimagnetic materials (the second one is called ferrites for short),
and it is these that are of real practical utility.
Magnetization decreases with increasing temperature. There is a
temperature, the Curie temperature T c , above which it disappears,
as in Figure 4.59. Its value for most ferromagnetic materials is well
above room temperature (typically 300–500°C).
Measuring Magnetic properties
Magnetic properties are measured by plotting an M−H curve. It
looks like Figure 4.60. If an increasing field H is applied to a previously demagnetized sample, starting at Point A on the figure, its
magnetization increases, slowly at first and then faster, following
the broken line until it finally tails off to a maximum, the saturation magnetization M s at Point B. If the field is now backed off, M
does not retrace its original path but retains some of its magnetization so that when H has reached zero, at Point C, some magnetizaFigure 4.59
Saturation magnetization decreases with
temperature, falling to zero at the Curie
temperature T c .
Saturation
magnetization, M s (A/m)
Temperature T (K)
Curie
temperature T c
M s at 0 K
0
Figure 4.58
A magnetic material exposed to a field H becomes
magnetized, concentrating the flux lines.
i
i
Flux lines
of inductance B
Magnetic
material