

88
5 Erosion and Deposition and Their Influence on Plasma …
1
10
100
0
5
1 0
1 5
2 0
2 5
PSL intensity [arb unit]
Distance from front [mm]
1
10
100
0
5
10
15
20
25
PSL intensity [arb unit]
Distance from front [mm]
1
10
100
0
5
10 15 20 25 30
PSL intensity [arb unit]
Distance from front [mm]
e-folding length: 7 mm
1
10
100
0
5
10
15
20
25
PSL intensity [arb unit]
Distance from front [mm]
e-folding length: 3 mm
(a)
(b)
(c)
(d)
Inner divertor
-
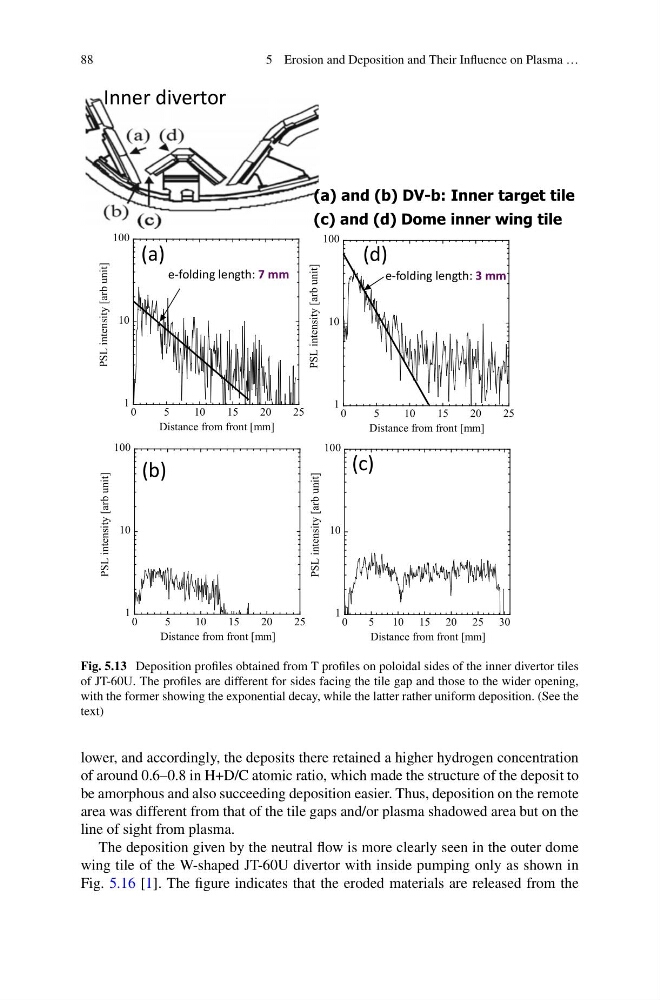
Fig. 5.13 Deposition profiles obtained from T profiles on poloidal sides of the inner divertor tiles
of JT-60U. The profiles are different for sides facing the tile gap and those to the wider opening,
with the former showing the exponential decay, while the latter rather uniform deposition. (See the
text)
lower, and accordingly, the deposits there retained a higher hydrogen concentration
of around 0.6–0.8 in H+D/C atomic ratio, which made the structure of the deposit to
be amorphous and also succeeding deposition easier. Thus, deposition on the remote
area was different from that of the tile gaps and/or plasma shadowed area but on the
line of sight from plasma.
The deposition given by the neutral flow is more clearly seen in the outer dome
wing tile of the W-shaped JT-60U divertor with inside pumping only as shown in
Fig. 5.16 [1]. The figure indicates that the eroded materials are released from the
5 Erosion and Deposition and Their Influence on Plasma …
1
10
100
0
5
1 0
1 5
2 0
2 5
PSL intensity [arb unit]
Distance from front [mm]
1
10
100
0
5
10
15
20
25
PSL intensity [arb unit]
Distance from front [mm]
1
10
100
0
5
10 15 20 25 30
PSL intensity [arb unit]
Distance from front [mm]
e-folding length: 7 mm
1
10
100
0
5
10
15
20
25
PSL intensity [arb unit]
Distance from front [mm]
e-folding length: 3 mm
(a)
(b)
(c)
(d)
Inner divertor
-
Fig. 5.13 Deposition profiles obtained from T profiles on poloidal sides of the inner divertor tiles
of JT-60U. The profiles are different for sides facing the tile gap and those to the wider opening,
with the former showing the exponential decay, while the latter rather uniform deposition. (See the
text)
lower, and accordingly, the deposits there retained a higher hydrogen concentration
of around 0.6–0.8 in H+D/C atomic ratio, which made the structure of the deposit to
be amorphous and also succeeding deposition easier. Thus, deposition on the remote
area was different from that of the tile gaps and/or plasma shadowed area but on the
line of sight from plasma.
The deposition given by the neutral flow is more clearly seen in the outer dome
wing tile of the W-shaped JT-60U divertor with inside pumping only as shown in
Fig. 5.16 [1]. The figure indicates that the eroded materials are released from the