

5.2 Erosion, Transport, and Deposition
79
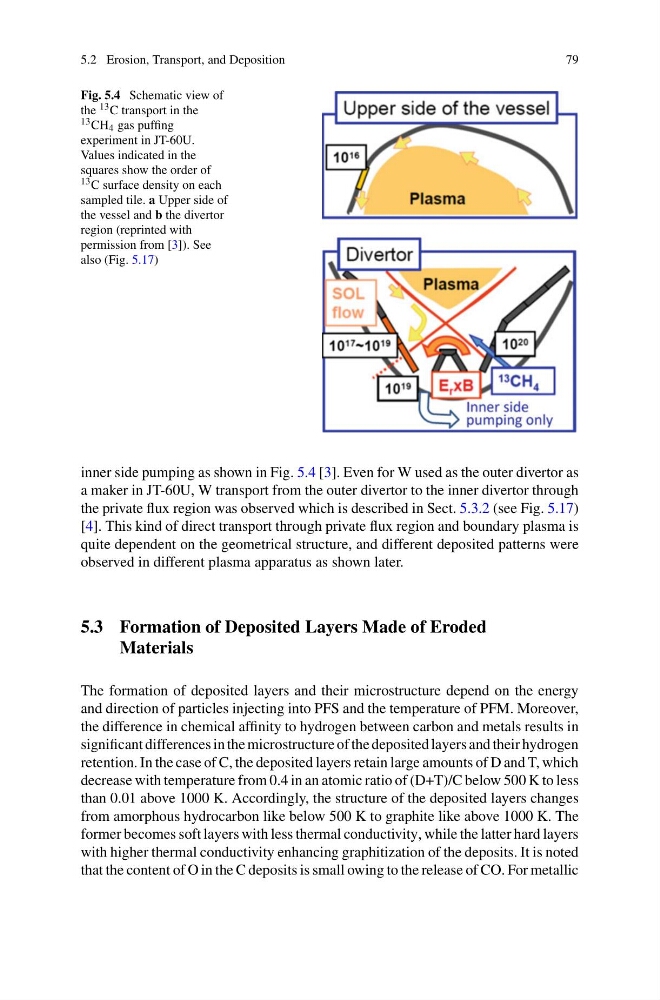
Fig. 5.4 Schematic view of
the 13 C transport in the
13 CH 4 gas puffing
experiment in JT-60U.
Values indicated in the
squares show the order of
13 C surface density on each
sampled tile. a Upper side of
the vessel and b the divertor
region (reprinted with
permission from [3]). See
also (Fig. 5.17)
inner side pumping as shown in Fig. 5.4 [3]. Even for W used as the outer divertor as
a maker in JT-60U, W transport from the outer divertor to the inner divertor through
the private flux region was observed which is described in Sect. 5.3.2 (see Fig. 5.17)
[4]. This kind of direct transport through private flux region and boundary plasma is
quite dependent on the geometrical structure, and different deposited patterns were
observed in different plasma apparatus as shown later.
5.3 Formation of Deposited Layers Made of Eroded
Materials
The formation of deposited layers and their microstructure depend on the energy
and direction of particles injecting into PFS and the temperature of PFM. Moreover,
the difference in chemical affinity to hydrogen between carbon and metals results in
significant differences in the microstructure of the deposited layers and their hydrogen
retention. In the case of C, the deposited layers retain large amounts of D and T, which
decrease with temperature from 0.4 in an atomic ratio of (D+T)/C below 500 K to less
than 0.01 above 1000 K. Accordingly, the structure of the deposited layers changes
from amorphous hydrocarbon like below 500 K to graphite like above 1000 K. The
former becomes soft layers with less thermal conductivity, while the latter hard layers
with higher thermal conductivity enhancing graphitization of the deposits. It is noted
that the content of O in the C deposits is small owing to the release of CO. For metallic
79
Fig. 5.4 Schematic view of
the 13 C transport in the
13 CH 4 gas puffing
experiment in JT-60U.
Values indicated in the
squares show the order of
13 C surface density on each
sampled tile. a Upper side of
the vessel and b the divertor
region (reprinted with
permission from [3]). See
also (Fig. 5.17)
inner side pumping as shown in Fig. 5.4 [3]. Even for W used as the outer divertor as
a maker in JT-60U, W transport from the outer divertor to the inner divertor through
the private flux region was observed which is described in Sect. 5.3.2 (see Fig. 5.17)
[4]. This kind of direct transport through private flux region and boundary plasma is
quite dependent on the geometrical structure, and different deposited patterns were
observed in different plasma apparatus as shown later.
5.3 Formation of Deposited Layers Made of Eroded
Materials
The formation of deposited layers and their microstructure depend on the energy
and direction of particles injecting into PFS and the temperature of PFM. Moreover,
the difference in chemical affinity to hydrogen between carbon and metals results in
significant differences in the microstructure of the deposited layers and their hydrogen
retention. In the case of C, the deposited layers retain large amounts of D and T, which
decrease with temperature from 0.4 in an atomic ratio of (D+T)/C below 500 K to less
than 0.01 above 1000 K. Accordingly, the structure of the deposited layers changes
from amorphous hydrocarbon like below 500 K to graphite like above 1000 K. The
former becomes soft layers with less thermal conductivity, while the latter hard layers
with higher thermal conductivity enhancing graphitization of the deposits. It is noted
that the content of O in the C deposits is small owing to the release of CO. For metallic