

78
5 Erosion and Deposition and Their Influence on Plasma …
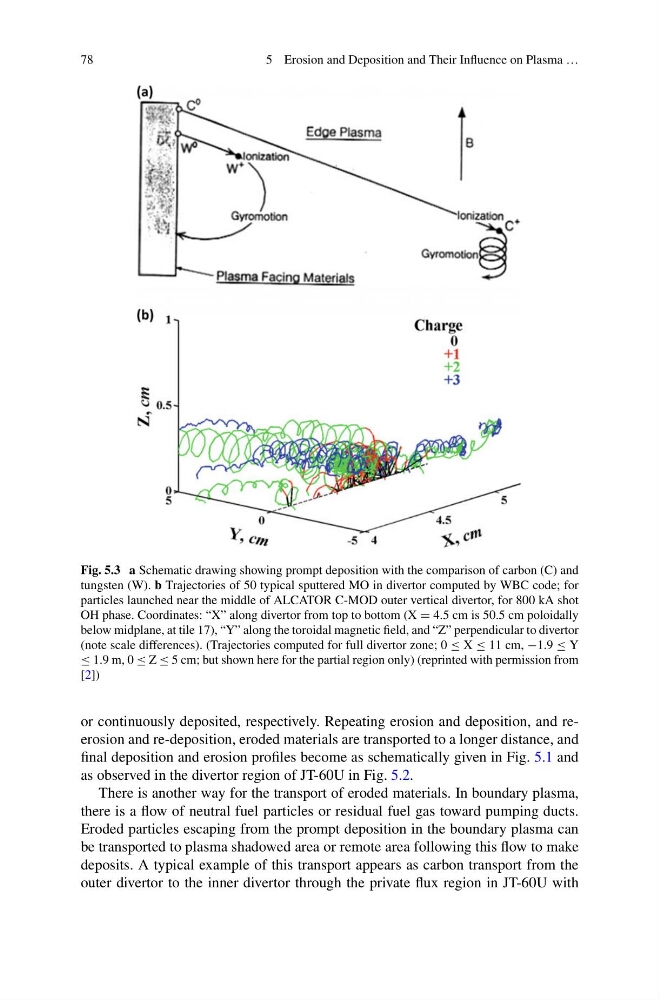
Fig. 5.3 a Schematic drawing showing prompt deposition with the comparison of carbon (C) and
tungsten (W). b Trajectories of 50 typical sputtered MO in divertor computed by WBC code; for
particles launched near the middle of ALCATOR C-MOD outer vertical divertor, for 800 kA shot
OH phase. Coordinates: “X” along divertor from top to bottom (X = 4.5 cm is 50.5 cm poloidally
below midplane, at tile 17), “Y” along the toroidal magnetic field, and “Z” perpendicular to divertor
(note scale differences). (Trajectories computed for full divertor zone; 0 ≤ X ≤ 11 cm, −1.9 ≤ Y
≤ 1.9 m, 0 ≤ Z ≤ 5 cm; but shown here for the partial region only) (reprinted with permission from
[2])
or continuously deposited, respectively. Repeating erosion and deposition, and reerosion and re-deposition, eroded materials are transported to a longer distance, and
final deposition and erosion profiles become as schematically given in Fig. 5.1 and
as observed in the divertor region of JT-60U in Fig. 5.2.
There is another way for the transport of eroded materials. In boundary plasma,
there is a flow of neutral fuel particles or residual fuel gas toward pumping ducts.
Eroded particles escaping from the prompt deposition in the boundary plasma can
be transported to plasma shadowed area or remote area following this flow to make
deposits. A typical example of this transport appears as carbon transport from the
outer divertor to the inner divertor through the private flux region in JT-60U with
5 Erosion and Deposition and Their Influence on Plasma …
Fig. 5.3 a Schematic drawing showing prompt deposition with the comparison of carbon (C) and
tungsten (W). b Trajectories of 50 typical sputtered MO in divertor computed by WBC code; for
particles launched near the middle of ALCATOR C-MOD outer vertical divertor, for 800 kA shot
OH phase. Coordinates: “X” along divertor from top to bottom (X = 4.5 cm is 50.5 cm poloidally
below midplane, at tile 17), “Y” along the toroidal magnetic field, and “Z” perpendicular to divertor
(note scale differences). (Trajectories computed for full divertor zone; 0 ≤ X ≤ 11 cm, −1.9 ≤ Y
≤ 1.9 m, 0 ≤ Z ≤ 5 cm; but shown here for the partial region only) (reprinted with permission from
[2])
or continuously deposited, respectively. Repeating erosion and deposition, and reerosion and re-deposition, eroded materials are transported to a longer distance, and
final deposition and erosion profiles become as schematically given in Fig. 5.1 and
as observed in the divertor region of JT-60U in Fig. 5.2.
There is another way for the transport of eroded materials. In boundary plasma,
there is a flow of neutral fuel particles or residual fuel gas toward pumping ducts.
Eroded particles escaping from the prompt deposition in the boundary plasma can
be transported to plasma shadowed area or remote area following this flow to make
deposits. A typical example of this transport appears as carbon transport from the
outer divertor to the inner divertor through the private flux region in JT-60U with