

32
2 Discharges in Current Large Tokamaks
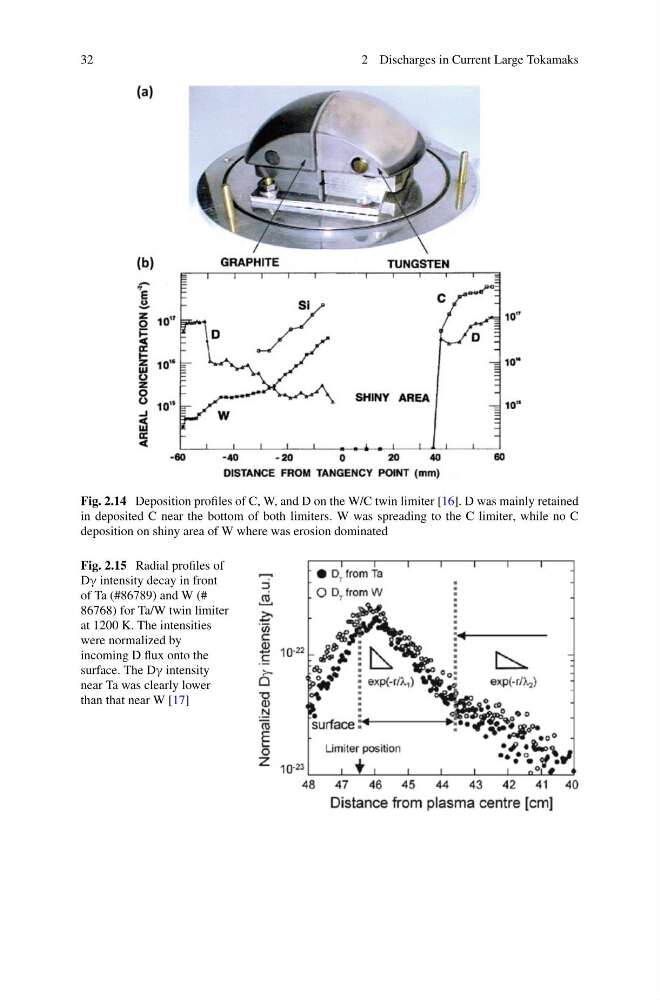
Fig. 2.14 Deposition profiles of C, W, and D on the W/C twin limiter [16]. D was mainly retained
in deposited C near the bottom of both limiters. W was spreading to the C limiter, while no C
deposition on shiny area of W where was erosion dominated
Fig. 2.15 Radial profiles of
Dγ intensity decay in front
of Ta (#86789) and W (#
86768) for Ta/W twin limiter
at 1200 K. The intensities
were normalized by
incoming D flux onto the
surface. The Dγ intensity
near Ta was clearly lower
than that near W [17]
2 Discharges in Current Large Tokamaks
Fig. 2.14 Deposition profiles of C, W, and D on the W/C twin limiter [16]. D was mainly retained
in deposited C near the bottom of both limiters. W was spreading to the C limiter, while no C
deposition on shiny area of W where was erosion dominated
Fig. 2.15 Radial profiles of
Dγ intensity decay in front
of Ta (#86789) and W (#
86768) for Ta/W twin limiter
at 1200 K. The intensities
were normalized by
incoming D flux onto the
surface. The Dγ intensity
near Ta was clearly lower
than that near W [17]