

2.3 Diagnostics for PMI Research
27
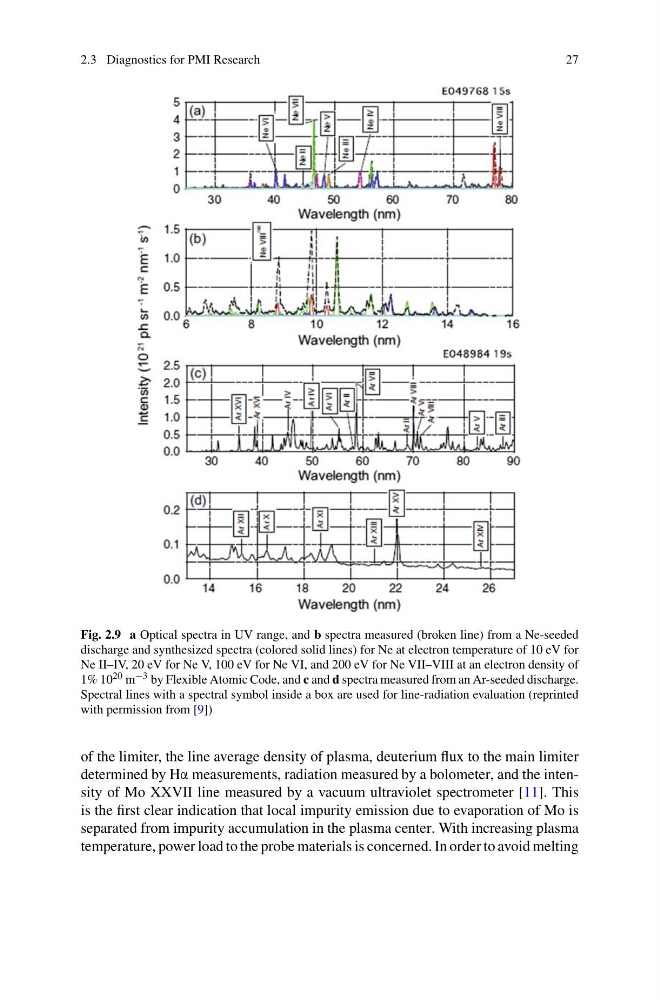
Fig. 2.9 a Optical spectra in UV range, and b spectra measured (broken line) from a Ne-seeded
discharge and synthesized spectra (colored solid lines) for Ne at electron temperature of 10 eV for
Ne II–IV, 20 eV for Ne V, 100 eV for Ne VI, and 200 eV for Ne VII–VIII at an electron density of
1% 10 20 m −3 by Flexible Atomic Code, and c and d spectra measured from an Ar-seeded discharge.
Spectral lines with a spectral symbol inside a box are used for line-radiation evaluation (reprinted
with permission from [9])
of the limiter, the line average density of plasma, deuterium flux to the main limiter
determined by Hα measurements, radiation measured by a bolometer, and the intensity of Mo XXVII line measured by a vacuum ultraviolet spectrometer [11]. This
is the first clear indication that local impurity emission due to evaporation of Mo is
separated from impurity accumulation in the plasma center. With increasing plasma
temperature, power load to the probe materials is concerned. In order to avoid melting
27
Fig. 2.9 a Optical spectra in UV range, and b spectra measured (broken line) from a Ne-seeded
discharge and synthesized spectra (colored solid lines) for Ne at electron temperature of 10 eV for
Ne II–IV, 20 eV for Ne V, 100 eV for Ne VI, and 200 eV for Ne VII–VIII at an electron density of
1% 10 20 m −3 by Flexible Atomic Code, and c and d spectra measured from an Ar-seeded discharge.
Spectral lines with a spectral symbol inside a box are used for line-radiation evaluation (reprinted
with permission from [9])
of the limiter, the line average density of plasma, deuterium flux to the main limiter
determined by Hα measurements, radiation measured by a bolometer, and the intensity of Mo XXVII line measured by a vacuum ultraviolet spectrometer [11]. This
is the first clear indication that local impurity emission due to evaporation of Mo is
separated from impurity accumulation in the plasma center. With increasing plasma
temperature, power load to the probe materials is concerned. In order to avoid melting