

9.2 Present Estimation of Fuel Retention in ITER
163
Nevertheless, these figures are used as reference until now. Figure 9.1a shows that
a build-up of the tritium inventory to the administrative limit of 700 g and max 1 kg
is attained within a few hundred nominal full power D/T discharges. The retention
in deposited C and Be is the dominant process in C-wall and Be-wall, respectively,
while bulk retention dominant in W-wall including significant increase caused by
neutron irradiation (see Fig. 9.1b). The estimates have been made for the steadystate operation with many simplified assumptions. For example, the effects of ELMs
and off-normal events are not considered. They will increase the surface temperature
of PFS which enhances thermal release of T resulting in less T retention in bulk
metals. Large uncertainties also arise, especially for a mixed material device, from
complex processes such as material intermixing in deposits and/or the formation
of new phases and alloys on the surface. The detailed geometrical structure of the
divertor plates and vessel walls was not considered. Retention in tile gaps and at
remote areas should be also added to the global inventory.
9.3 Construction of Fuel Retention Model in a Fusion
Reactor
The fuel retaining areas in a reactor vessel can be divided roughly into four: (1) plasma
facing area, (2) areas not directly exposed to plasma but on the line of site to plasma,
(3) plasma shadowed area where nonthermalized neutral fuel particles impinge, and
(4) far remote area where mostly thermalized fuel particles or remaining fuel gas
impinge. First two areas are further divided into two; erosion-dominated area and
deposition-dominated area. Depending on the areas, time sequences and mechanisms
of T retention are different. Areas giving major T retention in most of the present
tokamaks are (1) inner divertor, (2) outer dome, (3) tile gaps, and (4) deposits at
remote area. In contrast, most of the first wall and outer divertor are eroded. Hence,
T retention in these areas is excluded in the estimation of fuel retention in ITER given
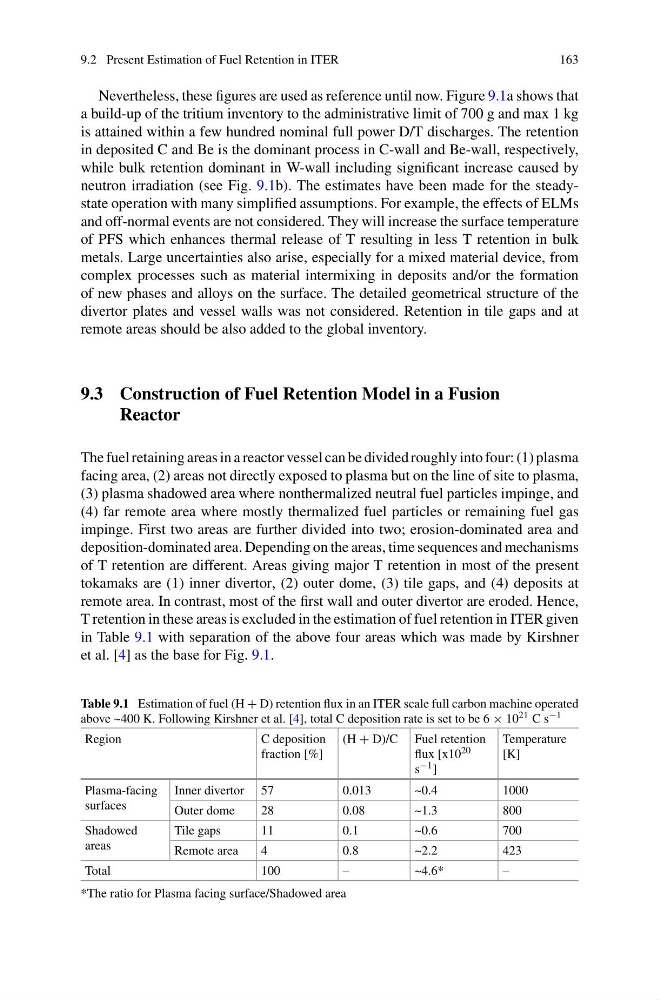
in Table 9.1 with separation of the above four areas which was made by Kirshner
et al. [4] as the base for Fig. 9.1.
Table 9.1 Estimation of fuel (H + D) retention flux in an ITER scale full carbon machine operated
above ~400 K. Following Kirshner et al. [4], total C deposition rate is set to be 6 × 10 21 C s −1
Region
C deposition
fraction [%]
(H + D)/C Fuel retention
flux [x10 20
s −1 ]
Temperature
[K]
Plasma-facing
surfaces
Inner divertor 57
0.013
~0.4
1000
Outer dome
28
0.08
~1.3
800
Shadowed
areas
Tile gaps
11
0.1
~0.6
700
Remote area
4
0.8
~2.2
423
Total
100
–
~4.6*
–
*The ratio for Plasma facing surface/Shadowed area
163
Nevertheless, these figures are used as reference until now. Figure 9.1a shows that
a build-up of the tritium inventory to the administrative limit of 700 g and max 1 kg
is attained within a few hundred nominal full power D/T discharges. The retention
in deposited C and Be is the dominant process in C-wall and Be-wall, respectively,
while bulk retention dominant in W-wall including significant increase caused by
neutron irradiation (see Fig. 9.1b). The estimates have been made for the steadystate operation with many simplified assumptions. For example, the effects of ELMs
and off-normal events are not considered. They will increase the surface temperature
of PFS which enhances thermal release of T resulting in less T retention in bulk
metals. Large uncertainties also arise, especially for a mixed material device, from
complex processes such as material intermixing in deposits and/or the formation
of new phases and alloys on the surface. The detailed geometrical structure of the
divertor plates and vessel walls was not considered. Retention in tile gaps and at
remote areas should be also added to the global inventory.
9.3 Construction of Fuel Retention Model in a Fusion
Reactor
The fuel retaining areas in a reactor vessel can be divided roughly into four: (1) plasma
facing area, (2) areas not directly exposed to plasma but on the line of site to plasma,
(3) plasma shadowed area where nonthermalized neutral fuel particles impinge, and
(4) far remote area where mostly thermalized fuel particles or remaining fuel gas
impinge. First two areas are further divided into two; erosion-dominated area and
deposition-dominated area. Depending on the areas, time sequences and mechanisms
of T retention are different. Areas giving major T retention in most of the present
tokamaks are (1) inner divertor, (2) outer dome, (3) tile gaps, and (4) deposits at
remote area. In contrast, most of the first wall and outer divertor are eroded. Hence,
T retention in these areas is excluded in the estimation of fuel retention in ITER given
in Table 9.1 with separation of the above four areas which was made by Kirshner
et al. [4] as the base for Fig. 9.1.
Table 9.1 Estimation of fuel (H + D) retention flux in an ITER scale full carbon machine operated
above ~400 K. Following Kirshner et al. [4], total C deposition rate is set to be 6 × 10 21 C s −1
Region
C deposition
fraction [%]
(H + D)/C Fuel retention
flux [x10 20
s −1 ]
Temperature
[K]
Plasma-facing
surfaces
Inner divertor 57
0.013
~0.4
1000
Outer dome
28
0.08
~1.3
800
Shadowed
areas
Tile gaps
11
0.1
~0.6
700
Remote area
4
0.8
~2.2
423
Total
100
–
~4.6*
–
*The ratio for Plasma facing surface/Shadowed area