

150
8 PMI in Large Tokamaks
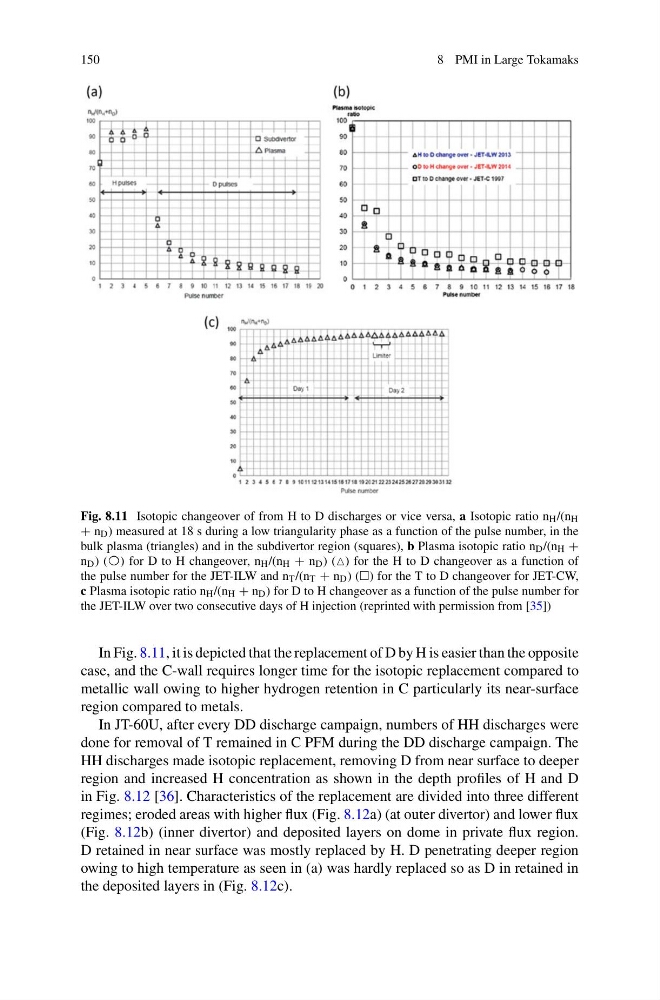
Fig. 8.11 Isotopic changeover of from H to D discharges or vice versa, a Isotopic ratio n H /(n H
+ n D ) measured at 18 s during a low triangularity phase as a function of the pulse number, in the
bulk plasma (triangles) and in the subdivertor region (squares), b Plasma isotopic ratio n D /(n H +
n D ) (〇) for D to H changeover, n H /(n H + n D ) () for the H to D changeover as a function of
the pulse number for the JET-ILW and n T /(n T + n D ) () for the T to D changeover for JET-CW,
c Plasma isotopic ratio n H /(n H + n D ) for D to H changeover as a function of the pulse number for
the JET-ILW over two consecutive days of H injection (reprinted with permission from [35])
In Fig. 8.11, it is depicted that the replacement of D by H is easier than the opposite
case, and the C-wall requires longer time for the isotopic replacement compared to
metallic wall owing to higher hydrogen retention in C particularly its near-surface
region compared to metals.
In JT-60U, after every DD discharge campaign, numbers of HH discharges were
done for removal of T remained in C PFM during the DD discharge campaign. The
HH discharges made isotopic replacement, removing D from near surface to deeper
region and increased H concentration as shown in the depth profiles of H and D
in Fig. 8.12 [36]. Characteristics of the replacement are divided into three different
regimes; eroded areas with higher flux (Fig. 8.12a) (at outer divertor) and lower flux
(Fig. 8.12b) (inner divertor) and deposited layers on dome in private flux region.
D retained in near surface was mostly replaced by H. D penetrating deeper region
owing to high temperature as seen in (a) was hardly replaced so as D in retained in
the deposited layers in (Fig. 8.12c).
8 PMI in Large Tokamaks
Fig. 8.11 Isotopic changeover of from H to D discharges or vice versa, a Isotopic ratio n H /(n H
+ n D ) measured at 18 s during a low triangularity phase as a function of the pulse number, in the
bulk plasma (triangles) and in the subdivertor region (squares), b Plasma isotopic ratio n D /(n H +
n D ) (〇) for D to H changeover, n H /(n H + n D ) () for the H to D changeover as a function of
the pulse number for the JET-ILW and n T /(n T + n D ) () for the T to D changeover for JET-CW,
c Plasma isotopic ratio n H /(n H + n D ) for D to H changeover as a function of the pulse number for
the JET-ILW over two consecutive days of H injection (reprinted with permission from [35])
In Fig. 8.11, it is depicted that the replacement of D by H is easier than the opposite
case, and the C-wall requires longer time for the isotopic replacement compared to
metallic wall owing to higher hydrogen retention in C particularly its near-surface
region compared to metals.
In JT-60U, after every DD discharge campaign, numbers of HH discharges were
done for removal of T remained in C PFM during the DD discharge campaign. The
HH discharges made isotopic replacement, removing D from near surface to deeper
region and increased H concentration as shown in the depth profiles of H and D
in Fig. 8.12 [36]. Characteristics of the replacement are divided into three different
regimes; eroded areas with higher flux (Fig. 8.12a) (at outer divertor) and lower flux
(Fig. 8.12b) (inner divertor) and deposited layers on dome in private flux region.
D retained in near surface was mostly replaced by H. D penetrating deeper region
owing to high temperature as seen in (a) was hardly replaced so as D in retained in
the deposited layers in (Fig. 8.12c).