

142
8 PMI in Large Tokamaks
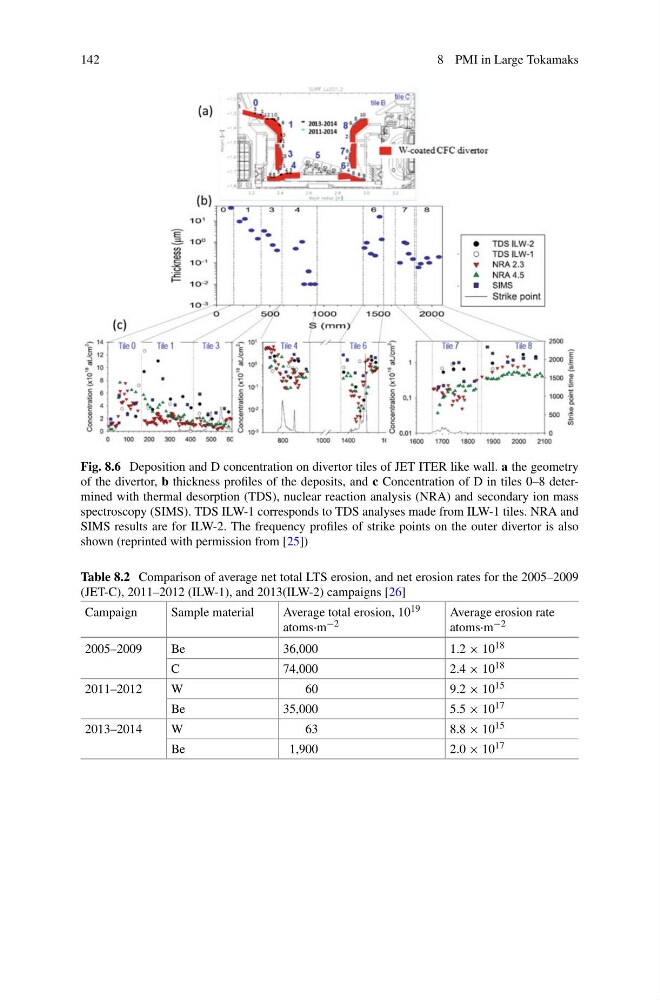
Fig. 8.6 Deposition and D concentration on divertor tiles of JET ITER like wall. a the geometry
of the divertor, b thickness profiles of the deposits, and c Concentration of D in tiles 0–8 determined with thermal desorption (TDS), nuclear reaction analysis (NRA) and secondary ion mass
spectroscopy (SIMS). TDS ILW-1 corresponds to TDS analyses made from ILW-1 tiles. NRA and
SIMS results are for ILW-2. The frequency profiles of strike points on the outer divertor is also
shown (reprinted with permission from [25])
Table 8.2 Comparison of average net total LTS erosion, and net erosion rates for the 2005–2009
(JET-C), 2011–2012 (ILW-1), and 2013(ILW-2) campaigns [26]
Campaign
Sample material
Average total erosion, 10 19
atoms·m −2
Average erosion rate
atoms·m −2
2005–2009
Be
36,000
1.2 × 10 18
C
74,000
2.4 × 10 18
2011–2012
W
60
9.2 × 10 15
Be
35,000
5.5 × 10 17
2013–2014
W
63
8.8 × 10 15
Be
1,900
2.0 × 10 17
8 PMI in Large Tokamaks
Fig. 8.6 Deposition and D concentration on divertor tiles of JET ITER like wall. a the geometry
of the divertor, b thickness profiles of the deposits, and c Concentration of D in tiles 0–8 determined with thermal desorption (TDS), nuclear reaction analysis (NRA) and secondary ion mass
spectroscopy (SIMS). TDS ILW-1 corresponds to TDS analyses made from ILW-1 tiles. NRA and
SIMS results are for ILW-2. The frequency profiles of strike points on the outer divertor is also
shown (reprinted with permission from [25])
Table 8.2 Comparison of average net total LTS erosion, and net erosion rates for the 2005–2009
(JET-C), 2011–2012 (ILW-1), and 2013(ILW-2) campaigns [26]
Campaign
Sample material
Average total erosion, 10 19
atoms·m −2
Average erosion rate
atoms·m −2
2005–2009
Be
36,000
1.2 × 10 18
C
74,000
2.4 × 10 18
2011–2012
W
60
9.2 × 10 15
Be
35,000
5.5 × 10 17
2013–2014
W
63
8.8 × 10 15
Be
1,900
2.0 × 10 17