

7.5 Permeation
123
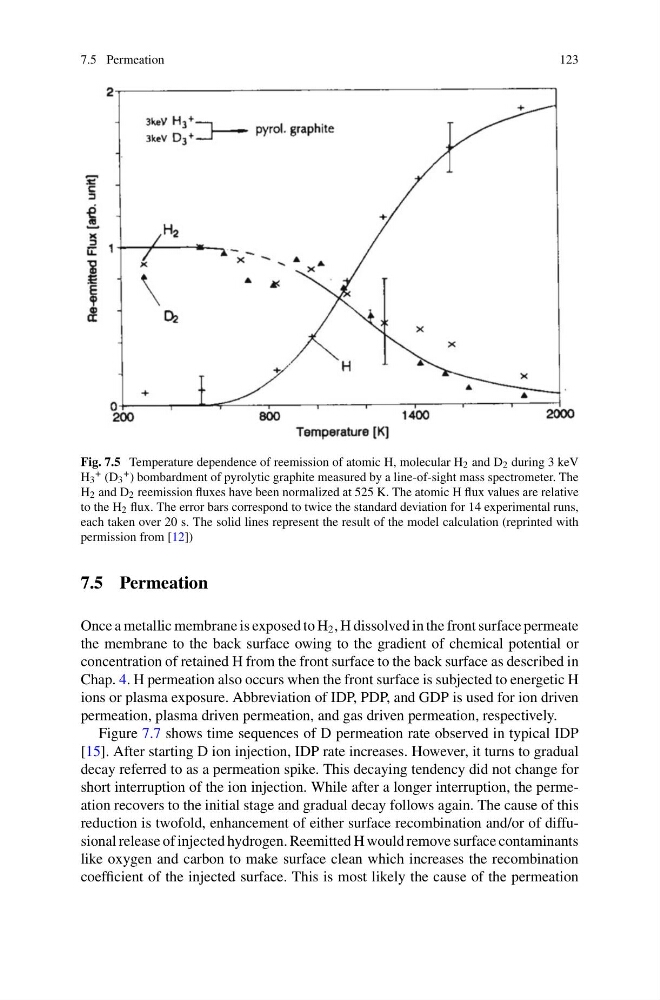
Fig. 7.5 Temperature dependence of reemission of atomic H, molecular H 2 and D 2 during 3 keV
H 3
+ (D 3
+ ) bombardment of pyrolytic graphite measured by a line-of-sight mass spectrometer. The
H 2 and D 2 reemission fluxes have been normalized at 525 K. The atomic H flux values are relative
to the H 2 flux. The error bars correspond to twice the standard deviation for 14 experimental runs,
each taken over 20 s. The solid lines represent the result of the model calculation (reprinted with
permission from [12])
7.5 Permeation
Once a metallic membrane is exposed to H 2 , H dissolved in the front surface permeate
the membrane to the back surface owing to the gradient of chemical potential or
concentration of retained H from the front surface to the back surface as described in
Chap. 4. H permeation also occurs when the front surface is subjected to energetic H
ions or plasma exposure. Abbreviation of IDP, PDP, and GDP is used for ion driven
permeation, plasma driven permeation, and gas driven permeation, respectively.
Figure 7.7 shows time sequences of D permeation rate observed in typical IDP
[15]. After starting D ion injection, IDP rate increases. However, it turns to gradual
decay referred to as a permeation spike. This decaying tendency did not change for
short interruption of the ion injection. While after a longer interruption, the permeation recovers to the initial stage and gradual decay follows again. The cause of this
reduction is twofold, enhancement of either surface recombination and/or of diffusional release of injected hydrogen. Reemitted H would remove surface contaminants
like oxygen and carbon to make surface clean which increases the recombination
coefficient of the injected surface. This is most likely the cause of the permeation
123
Fig. 7.5 Temperature dependence of reemission of atomic H, molecular H 2 and D 2 during 3 keV
H 3
+ (D 3
+ ) bombardment of pyrolytic graphite measured by a line-of-sight mass spectrometer. The
H 2 and D 2 reemission fluxes have been normalized at 525 K. The atomic H flux values are relative
to the H 2 flux. The error bars correspond to twice the standard deviation for 14 experimental runs,
each taken over 20 s. The solid lines represent the result of the model calculation (reprinted with
permission from [12])
7.5 Permeation
Once a metallic membrane is exposed to H 2 , H dissolved in the front surface permeate
the membrane to the back surface owing to the gradient of chemical potential or
concentration of retained H from the front surface to the back surface as described in
Chap. 4. H permeation also occurs when the front surface is subjected to energetic H
ions or plasma exposure. Abbreviation of IDP, PDP, and GDP is used for ion driven
permeation, plasma driven permeation, and gas driven permeation, respectively.
Figure 7.7 shows time sequences of D permeation rate observed in typical IDP
[15]. After starting D ion injection, IDP rate increases. However, it turns to gradual
decay referred to as a permeation spike. This decaying tendency did not change for
short interruption of the ion injection. While after a longer interruption, the permeation recovers to the initial stage and gradual decay follows again. The cause of this
reduction is twofold, enhancement of either surface recombination and/or of diffusional release of injected hydrogen. Reemitted H would remove surface contaminants
like oxygen and carbon to make surface clean which increases the recombination
coefficient of the injected surface. This is most likely the cause of the permeation