

The latter practice also increases the infiltration of salt water in aquifers, lowering the
quality of such water and its use in agriculture and as drinking water.
However, the global average water level in the oceans rose by 3.6 mm/y from
2006 to 2015, which was 2.5 times the average rate of 1.4 mm/y throughout most of
the twentieth century. Such trend brings to a rise, by the end of this century, of
0.3 m above 2000s’ levels, even wishing that GHG emission follows a relatively
low trend during next 80 years. Heat is stored at different rates in the oceans,
depending on deepness. Even winds and marine currents make a difference and can
strongly influence tides. Therefore, the rise of the water level may vary with the
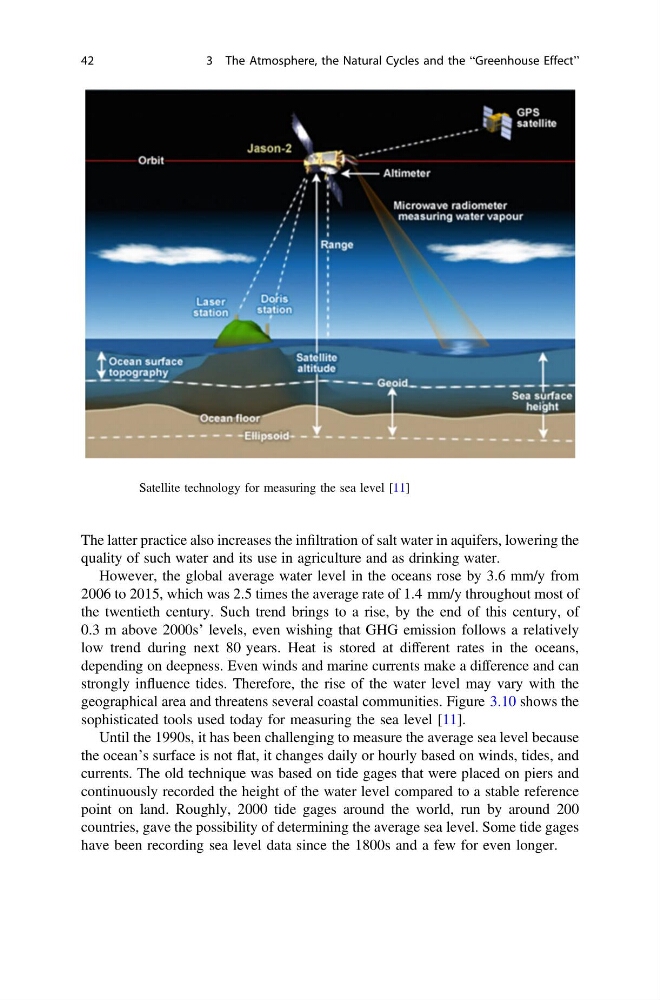
geographical area and threatens several coastal communities. Figure 3.10 shows the
sophisticated tools used today for measuring the sea level [11].
Until the 1990s, it has been challenging to measure the average sea level because
the ocean’s surface is not flat, it changes daily or hourly based on winds, tides, and
currents. The old technique was based on tide gages that were placed on piers and
continuously recorded the height of the water level compared to a stable reference
point on land. Roughly, 2000 tide gages around the world, run by around 200
countries, gave the possibility of determining the average sea level. Some tide gages
have been recording sea level data since the 1800s and a few for even longer.
Fig. 3.10 Satellite technology for measuring the sea level [11]
42
3 The Atmosphere, the Natural Cycles and the “Greenhouse Effect”
quality of such water and its use in agriculture and as drinking water.
However, the global average water level in the oceans rose by 3.6 mm/y from
2006 to 2015, which was 2.5 times the average rate of 1.4 mm/y throughout most of
the twentieth century. Such trend brings to a rise, by the end of this century, of
0.3 m above 2000s’ levels, even wishing that GHG emission follows a relatively
low trend during next 80 years. Heat is stored at different rates in the oceans,
depending on deepness. Even winds and marine currents make a difference and can
strongly influence tides. Therefore, the rise of the water level may vary with the
geographical area and threatens several coastal communities. Figure 3.10 shows the
sophisticated tools used today for measuring the sea level [11].
Until the 1990s, it has been challenging to measure the average sea level because
the ocean’s surface is not flat, it changes daily or hourly based on winds, tides, and
currents. The old technique was based on tide gages that were placed on piers and
continuously recorded the height of the water level compared to a stable reference
point on land. Roughly, 2000 tide gages around the world, run by around 200
countries, gave the possibility of determining the average sea level. Some tide gages
have been recording sea level data since the 1800s and a few for even longer.
Fig. 3.10 Satellite technology for measuring the sea level [11]
42
3 The Atmosphere, the Natural Cycles and the “Greenhouse Effect”