

568
G. Filippi and M. Vasile
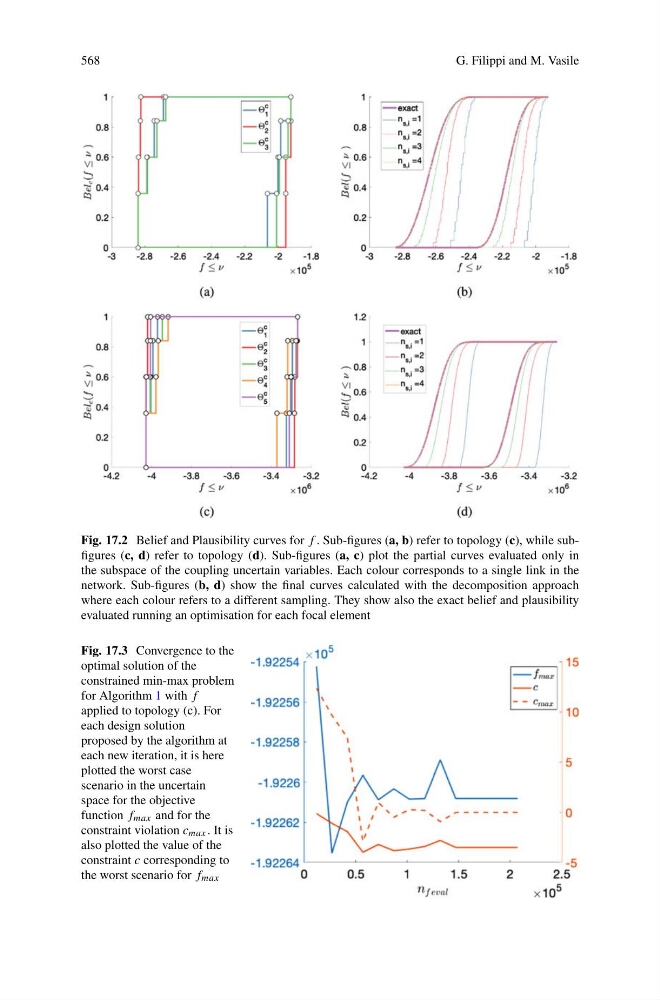
Fig. 17.2 Belief and Plausibility curves for f . Sub-figures (a, b) refer to topology (c), while subfigures (c, d) refer to topology (d). Sub-figures (a, c) plot the partial curves evaluated only in
the subspace of the coupling uncertain variables. Each colour corresponds to a single link in the
network. Sub-figures (b, d) show the final curves calculated with the decomposition approach
where each colour refers to a different sampling. They show also the exact belief and plausibility
evaluated running an optimisation for each focal element
Fig. 17.3 Convergence to the
optimal solution of the
constrained min-max problem
for Algorithm 1 with f
applied to topology (c). For
each design solution
proposed by the algorithm at
each new iteration, it is here
plotted the worst case
scenario in the uncertain
space for the objective
function f max and for the
constraint violation c max . It is
also plotted the value of the
constraint c corresponding to
the worst scenario for f max