

12 Response Surface Methodology
391
Fig. 12.1 Separation
distance q and fill distance h
for a two-dimensional sample
of training points
q
h
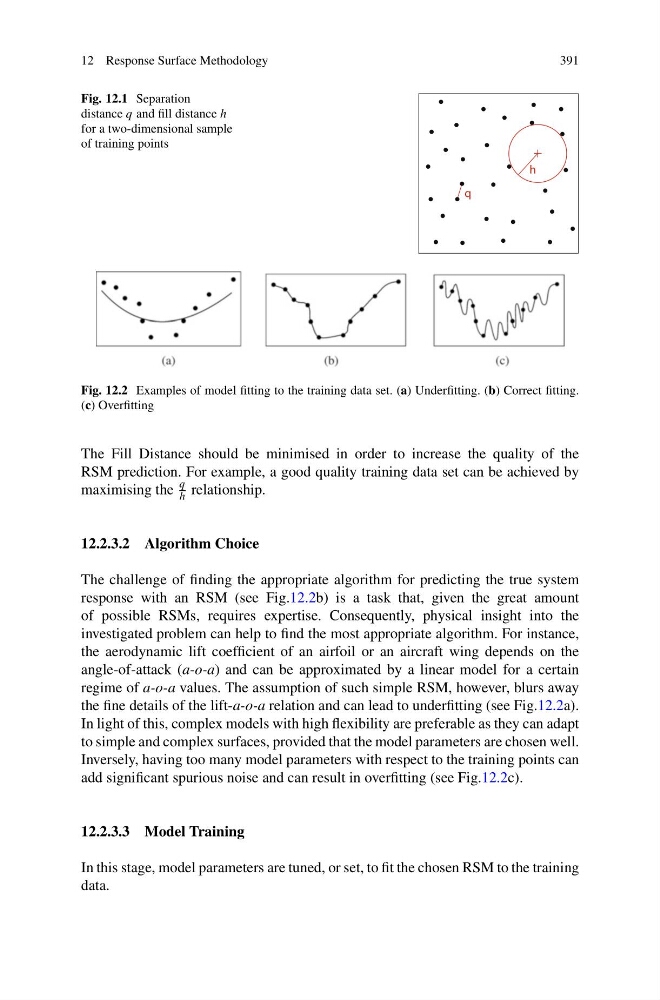
Fig. 12.2 Examples of model fitting to the training data set. (a) Underfitting. (b) Correct fitting.
(c) Overfitting
The Fill Distance should be minimised in order to increase the quality of the
RSM prediction. For example, a good quality training data set can be achieved by
maximising the
q
h relationship.
12.2.3.2 Algorithm Choice
The challenge of finding the appropriate algorithm for predicting the true system
response with an RSM (see Fig.12.2b) is a task that, given the great amount
of possible RSMs, requires expertise. Consequently, physical insight into the
investigated problem can help to find the most appropriate algorithm. For instance,
the aerodynamic lift coefficient of an airfoil or an aircraft wing depends on the
angle-of-attack (a-o-a) and can be approximated by a linear model for a certain
regime of a-o-a values. The assumption of such simple RSM, however, blurs away
the fine details of the lift-a-o-a relation and can lead to underfitting (see Fig.12.2a).
In light of this, complex models with high flexibility are preferable as they can adapt
to simple and complex surfaces, provided that the model parameters are chosen well.
Inversely, having too many model parameters with respect to the training points can
add significant spurious noise and can result in overfitting (see Fig.12.2c).
12.2.3.3 Model Training
In this stage, model parameters are tuned, or set, to fit the chosen RSM to the training
data.
391
Fig. 12.1 Separation
distance q and fill distance h
for a two-dimensional sample
of training points
q
h
Fig. 12.2 Examples of model fitting to the training data set. (a) Underfitting. (b) Correct fitting.
(c) Overfitting
The Fill Distance should be minimised in order to increase the quality of the
RSM prediction. For example, a good quality training data set can be achieved by
maximising the
q
h relationship.
12.2.3.2 Algorithm Choice
The challenge of finding the appropriate algorithm for predicting the true system
response with an RSM (see Fig.12.2b) is a task that, given the great amount
of possible RSMs, requires expertise. Consequently, physical insight into the
investigated problem can help to find the most appropriate algorithm. For instance,
the aerodynamic lift coefficient of an airfoil or an aircraft wing depends on the
angle-of-attack (a-o-a) and can be approximated by a linear model for a certain
regime of a-o-a values. The assumption of such simple RSM, however, blurs away
the fine details of the lift-a-o-a relation and can lead to underfitting (see Fig.12.2a).
In light of this, complex models with high flexibility are preferable as they can adapt
to simple and complex surfaces, provided that the model parameters are chosen well.
Inversely, having too many model parameters with respect to the training points can
add significant spurious noise and can result in overfitting (see Fig.12.2c).
12.2.3.3 Model Training
In this stage, model parameters are tuned, or set, to fit the chosen RSM to the training
data.