

130
D. Krpelík et al.
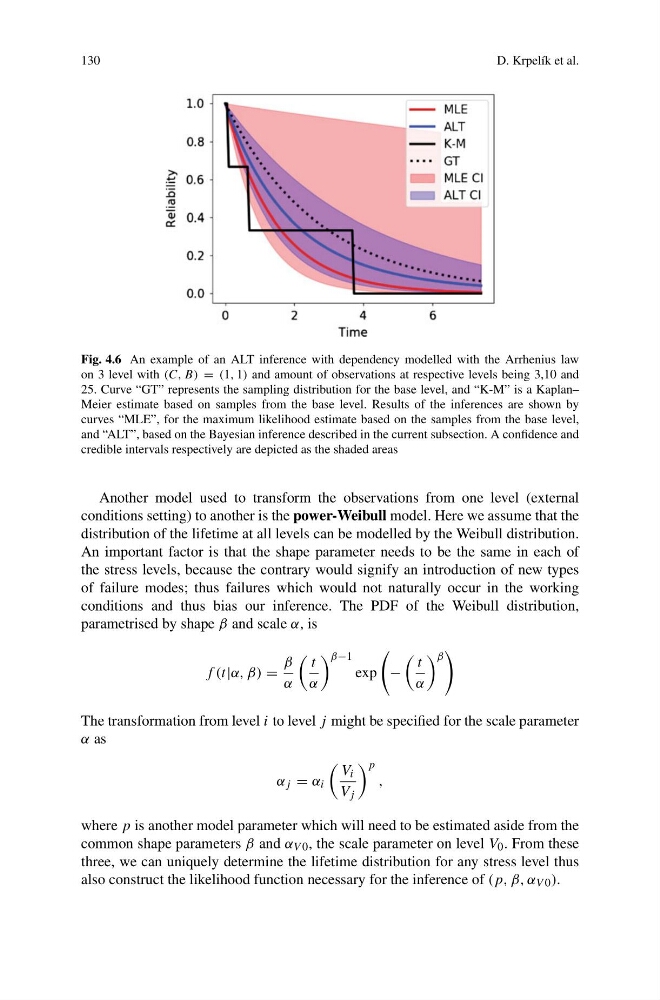
Fig. 4.6 An example of an ALT inference with dependency modelled with the Arrhenius law
on 3 level with (C, B) = (1, 1) and amount of observations at respective levels being 3,10 and
25. Curve “GT” represents the sampling distribution for the base level, and “K-M” is a Kaplan–
Meier estimate based on samples from the base level. Results of the inferences are shown by
curves “MLE”, for the maximum likelihood estimate based on the samples from the base level,
and “ALT”, based on the Bayesian inference described in the current subsection. A confidence and
credible intervals respectively are depicted as the shaded areas
Another model used to transform the observations from one level (external
conditions setting) to another is the power-Weibull model. Here we assume that the
distribution of the lifetime at all levels can be modelled by the Weibull distribution.
An important factor is that the shape parameter needs to be the same in each of
the stress levels, because the contrary would signify an introduction of new types
of failure modes; thus failures which would not naturally occur in the working
conditions and thus bias our inference. The PDF of the Weibull distribution,
parametrised by shape β and scale α, is
f (t|α, β) =
β
α
t
α
β−1
exp
−
t
α
β
The transformation from level i to level j might be specified for the scale parameter
α as
α j = α i
V i
V j
p
,
where p is another model parameter which will need to be estimated aside from the
common shape parameters β and α V 0 , the scale parameter on level V 0 . From these
three, we can uniquely determine the lifetime distribution for any stress level thus
also construct the likelihood function necessary for the inference of (p, β, α V 0 ).
D. Krpelík et al.
Fig. 4.6 An example of an ALT inference with dependency modelled with the Arrhenius law
on 3 level with (C, B) = (1, 1) and amount of observations at respective levels being 3,10 and
25. Curve “GT” represents the sampling distribution for the base level, and “K-M” is a Kaplan–
Meier estimate based on samples from the base level. Results of the inferences are shown by
curves “MLE”, for the maximum likelihood estimate based on the samples from the base level,
and “ALT”, based on the Bayesian inference described in the current subsection. A confidence and
credible intervals respectively are depicted as the shaded areas
Another model used to transform the observations from one level (external
conditions setting) to another is the power-Weibull model. Here we assume that the
distribution of the lifetime at all levels can be modelled by the Weibull distribution.
An important factor is that the shape parameter needs to be the same in each of
the stress levels, because the contrary would signify an introduction of new types
of failure modes; thus failures which would not naturally occur in the working
conditions and thus bias our inference. The PDF of the Weibull distribution,
parametrised by shape β and scale α, is
f (t|α, β) =
β
α
t
α
β−1
exp
−
t
α
β
The transformation from level i to level j might be specified for the scale parameter
α as
α j = α i
V i
V j
p
,
where p is another model parameter which will need to be estimated aside from the
common shape parameters β and α V 0 , the scale parameter on level V 0 . From these
three, we can uniquely determine the lifetime distribution for any stress level thus
also construct the likelihood function necessary for the inference of (p, β, α V 0 ).