

120
D. Krpelík et al.
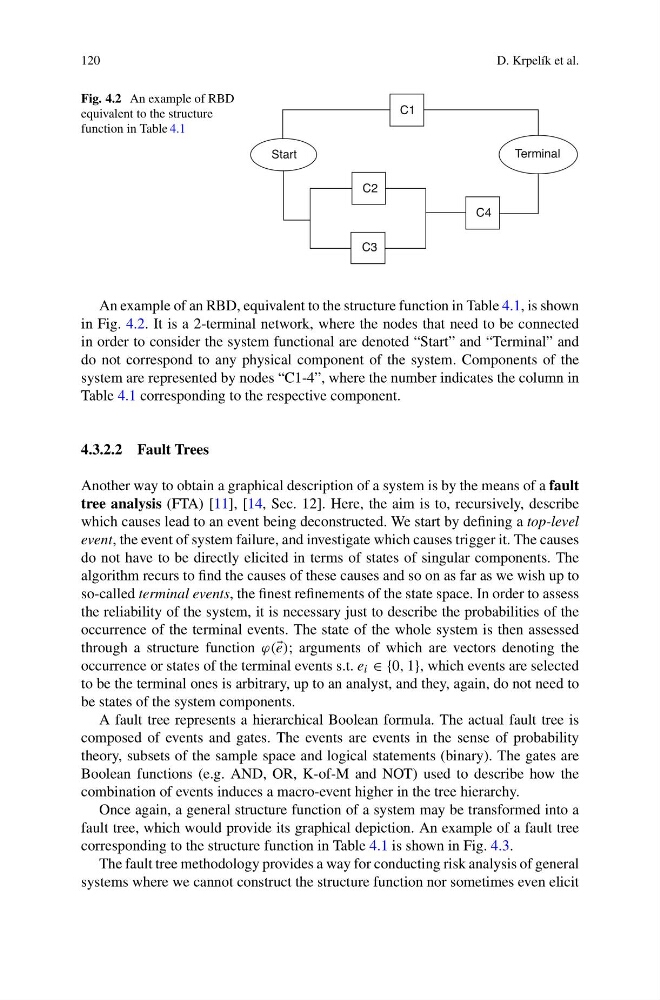
Fig. 4.2 An example of RBD
equivalent to the structure
function in Table 4.1
C1
C2
C3
C4
Start
Terminal
An example of an RBD, equivalent to the structure function in Table 4.1, is shown
in Fig. 4.2. It is a 2-terminal network, where the nodes that need to be connected
in order to consider the system functional are denoted “Start” and “Terminal” and
do not correspond to any physical component of the system. Components of the
system are represented by nodes “C1-4”, where the number indicates the column in
Table 4.1 corresponding to the respective component.
4.3.2.2 Fault Trees
Another way to obtain a graphical description of a system is by the means of a fault
tree analysis (FTA) [11], [14, Sec. 12]. Here, the aim is to, recursively, describe
which causes lead to an event being deconstructed. We start by defining a top-level
event, the event of system failure, and investigate which causes trigger it. The causes
do not have to be directly elicited in terms of states of singular components. The
algorithm recurs to find the causes of these causes and so on as far as we wish up to
so-called terminal events, the finest refinements of the state space. In order to assess
the reliability of the system, it is necessary just to describe the probabilities of the
occurrence of the terminal events. The state of the whole system is then assessed
through a structure function ϕ( e); arguments of which are vectors denoting the
occurrence or states of the terminal events s.t. e i ∈ {0, 1}, which events are selected
to be the terminal ones is arbitrary, up to an analyst, and they, again, do not need to
be states of the system components.
A fault tree represents a hierarchical Boolean formula. The actual fault tree is
composed of events and gates. The events are events in the sense of probability
theory, subsets of the sample space and logical statements (binary). The gates are
Boolean functions (e.g. AND, OR, K-of-M and NOT) used to describe how the
combination of events induces a macro-event higher in the tree hierarchy.
Once again, a general structure function of a system may be transformed into a
fault tree, which would provide its graphical depiction. An example of a fault tree
corresponding to the structure function in Table 4.1 is shown in Fig. 4.3.
The fault tree methodology provides a way for conducting risk analysis of general
systems where we cannot construct the structure function nor sometimes even elicit
D. Krpelík et al.
Fig. 4.2 An example of RBD
equivalent to the structure
function in Table 4.1
C1
C2
C3
C4
Start
Terminal
An example of an RBD, equivalent to the structure function in Table 4.1, is shown
in Fig. 4.2. It is a 2-terminal network, where the nodes that need to be connected
in order to consider the system functional are denoted “Start” and “Terminal” and
do not correspond to any physical component of the system. Components of the
system are represented by nodes “C1-4”, where the number indicates the column in
Table 4.1 corresponding to the respective component.
4.3.2.2 Fault Trees
Another way to obtain a graphical description of a system is by the means of a fault
tree analysis (FTA) [11], [14, Sec. 12]. Here, the aim is to, recursively, describe
which causes lead to an event being deconstructed. We start by defining a top-level
event, the event of system failure, and investigate which causes trigger it. The causes
do not have to be directly elicited in terms of states of singular components. The
algorithm recurs to find the causes of these causes and so on as far as we wish up to
so-called terminal events, the finest refinements of the state space. In order to assess
the reliability of the system, it is necessary just to describe the probabilities of the
occurrence of the terminal events. The state of the whole system is then assessed
through a structure function ϕ( e); arguments of which are vectors denoting the
occurrence or states of the terminal events s.t. e i ∈ {0, 1}, which events are selected
to be the terminal ones is arbitrary, up to an analyst, and they, again, do not need to
be states of the system components.
A fault tree represents a hierarchical Boolean formula. The actual fault tree is
composed of events and gates. The events are events in the sense of probability
theory, subsets of the sample space and logical statements (binary). The gates are
Boolean functions (e.g. AND, OR, K-of-M and NOT) used to describe how the
combination of events induces a macro-event higher in the tree hierarchy.
Once again, a general structure function of a system may be transformed into a
fault tree, which would provide its graphical depiction. An example of a fault tree
corresponding to the structure function in Table 4.1 is shown in Fig. 4.3.
The fault tree methodology provides a way for conducting risk analysis of general
systems where we cannot construct the structure function nor sometimes even elicit